What is the WebConsole ?It's a web application that allow to:
|
Overview
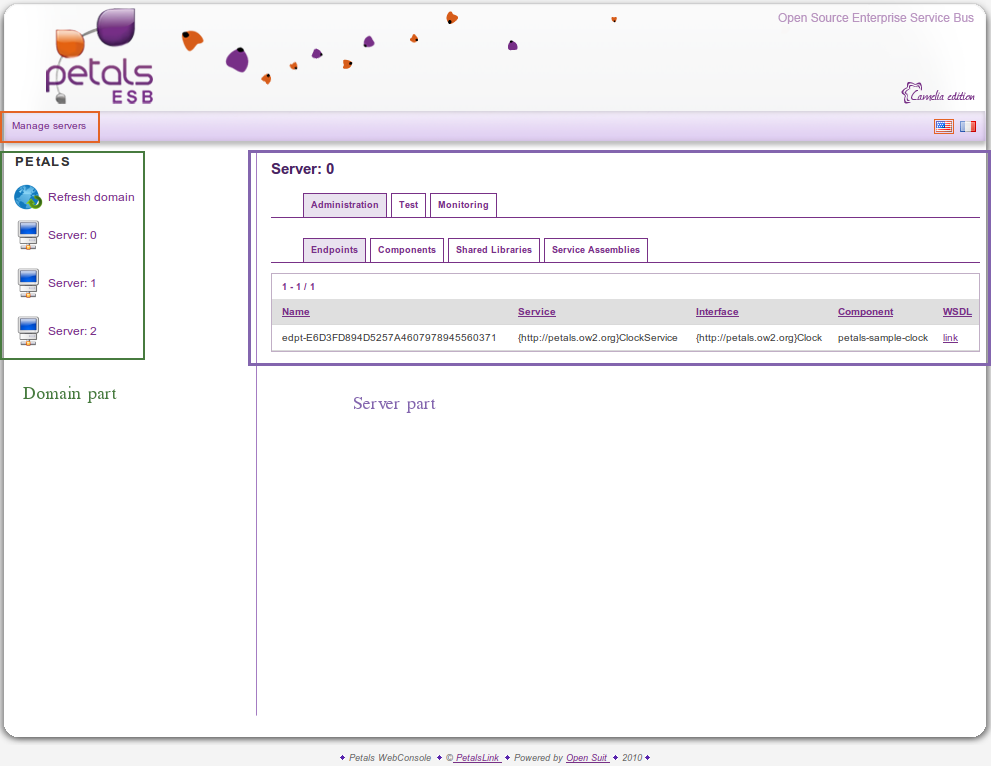
Petals Webconsole is divided into three parts as detailed below:
These three parts are:
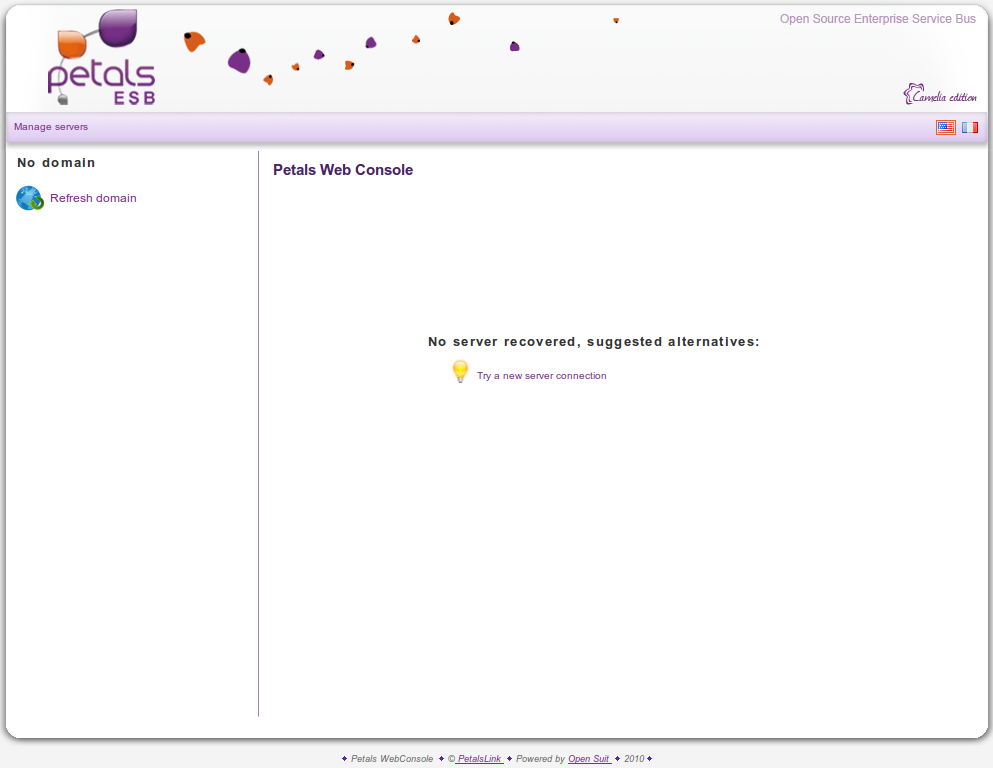
- Connection Part
- Domain Part
- Server Part
Connection Part
This view part is the the little purple headband to the page top, its contains two buttons:
- Change server
- Manage connections
The Change server button allows to dynamically change the current server connection. For example if you are
logged on Server 0 you can try to connect to another server like Server 1.
The Manage connections button allows to manipulate all declared connections for the Webconsole.
Domain Part
This view part contains a menu which represent all discovered servers from the recovered Petals topology,
when the Webconsole succeeded a connection to a server declared into the webconsole.xml configuration file.
Two element types are displayed:
 |
A click performed on this type allow to update the current domain, where the WebConsole is connected. |
 |
A click performed on this type allow to update the Server Part, with linked informations to the selected server. |
Server Part
This view part allow to display several informations about the current selected server,
and performe several interactions on it. I this part of the view, three main tabs are
available:
- Administration
- Test
- Monitoring
The Administration tab allows to manage components, shared libraries and service assemblies, but also get several
informations about endpoints exposed from Petals ESB. Other secondary features are also available like modify
runtime component attributes and modify level of component loggers.
The Test tab allows to performe test, check availability of exposed services, analyse services responses.
In order to make available this tab, one petals-se-rmi must be:
- Installed and started on at least one node of the current topology
- Declared into the webconsole.xml configuration file
The Monitoring tab allows to define monitoring filters, manage them and display informations of each filter.
The main feature is still the message exchanges monitoring, with a detailed overview of each exchange
and several information charts.