Installation
Nagios installation
The Nagios integration was experienced on a Linux distribution "Ubuntu Raring Ringtail (13.04)", using the Sun/Oracle JVM v1.6.0.43
Nagios 3 is available through the default Ubuntu repository. So, just install the package "nagios3" using the standard way.
Enabling the SNMP agents of the Petals ESB JVMs
As the monitoring tools can use SNMP probes to get information from the JVM running Petals ESB, we need to enable the SNMP agent of the JVM of each Petals ESB node. On each Petals node, in the environment configuration file, uncomment the system properties relative to the SNMP agent:
# Uncomment following lines to enable SNMP agent of the JVM
PETALS_JAVA_OPTS="$PETALS_JAVA_OPTS -Dcom.sun.management.snmp.port=16161"
PETALS_JAVA_OPTS="$PETALS_JAVA_OPTS -Dcom.sun.management.snmp.interface=0.0.0.0"
PETALS_JAVA_OPTS="$PETALS_JAVA_OPTS -Dcom.sun.management.snmp.acl.file=/etc/petals-esb/default-snmp.acl"
Adjust your SNMP port, interface and ACL.
| Caution, if Petals ESB runs with a user different from root, you need to use a port upper than 1024. To use a port lower than 1024 with a Petals ESB launches with a standard user, refers to the utility privbind (available in standard Ubuntu repository). |
| To use the same port on the same machine for several java processes, refers to snmpd used as proxy. |
| Caution, the ACL file should be accessible (read and write: 'chmod 600 xxx') only by the user running the JVM process. |
| If you use OpenJDK as Java virtual machine, you can't enable the SNMP agent. It is missing because of a non-free implementation. Move to the JVM provided by Oracle. |
Nagios configuration
Core configuration
All the following configurations are grouped in the attached file to put in your directory /etc/nagios3/conf.d/petals-esb.cfg.
Petals ESB administrators
Define your Petals ESB administrator as following. For each administrator, don't forget to add it to the contact group:
define contact {
        contact_name                    cde
        alias                           Christophe DENEUX
        host_notification_period        24x7
        service_notification_period     24x7
        host_notification_options       d,u,r
        service_notification_options    w,u,c,r
        host_notification_commands      notify-host-by-email
        service_notification_commands   notify-service-by-email
        email                           christophe.deneux@linagora.com
}

define contactgroup {
        contactgroup_name       petals-esb
        alias                   Petals ESB Administrators
        members                 cde
}
JVM host template
A best practice to monitor Java application is to create a template 'JVM host':
define host{
        use                             generic-host
        name                            jvm-host    ; The name of this host template
        notifications_enabled           1           ; Host notifications are enabled
        event_handler_enabled           1           ; Host event handler is enabled
        flap_detection_enabled          1           ; Flap detection is enabled
        failure_prediction_enabled      1           ; Failure prediction is enabled
        process_perf_data               1           ; Process performance data
        retain_status_information       1           ; Retain status information across program restarts
        retain_nonstatus_information    1           ; Retain non-status information across program restarts
        check_command                   check-host-alive
        max_check_attempts              10
        notification_interval           0
        notification_period             24x7
        notification_options            d,u,r
        contact_groups                  admins
        register                        0           ; DONT REGISTER THIS DEFINITION - ITS NOT A REAL HOST, JUST A TEMPLATE!
# Specific attributes
        _snmpport                       161         ; Listening port of the JVM SNMP agent
        }
Nagios commands definition to interact with a SNMP agent
We recommand to define specific Nagios command to interact with the Java virtual machine MIB.
Interresting commands will be:
- jvm_heapused: to get the real heap memory used by the Petals ESB node,
- jvm_heapmaxused: to get the current allocated (commited) heap size. This value should be check against the heap max size at the JVM level to generate alarms.
# 'jvm_heapused' command definition
define command{
    command_name    jvm_heapused
    command_line    /usr/lib/nagios/plugins/check_snmp -H '$HOSTADDRESS$' -p '$_HOSTSNMPPORT$' -C '$ARG1$' -P '$ARG2$' -o 1.3.6.1.4.1.42.2.145.3.163.1.1.2.11.0 -w :'$ARG3$' -c :'$ARG4$' -l load
    }

# 'jvm_heapmaxused' command definition
define command{
    command_name    jvm_heapmaxused
    command_line    /usr/lib/nagios/plugins/check_snmp -H '$HOSTADDRESS$' -p '$_HOSTSNMPPORT$' -C '$ARG1$' -P '$ARG2$' -o 1.3.6.1.4.1.42.2.145.3.163.1.1.2.12.0 -w :'$ARG3$' -c :'$ARG4$' -l load
    }
Petals ESB host template
A best practice to monitor Petals ESB nodes is to create a template 'Petals ESB host' that inherits from the 'JVM host':
define host{
        use                             jvm-host
        name                            petals-esb-host    ; The name of this host template
        register                        0                  ; DONT REGISTER THIS DEFINITION - ITS NOT A REAL HOST, JUST A TEMPLATE!
        contact_groups                  petals-esb

# Specific attributes
        _snmpport                       16161              ; Listening port of the JVM SNMP agent. Redefined because Petals is not started by 'root'
        _jmxport                        7700               ; Listening port of the Petals JMX agent
        _jmxuser                        petals             ; JMX credentials: username
        _jmxpassword                    petals             ; JMX credentials: password
        }
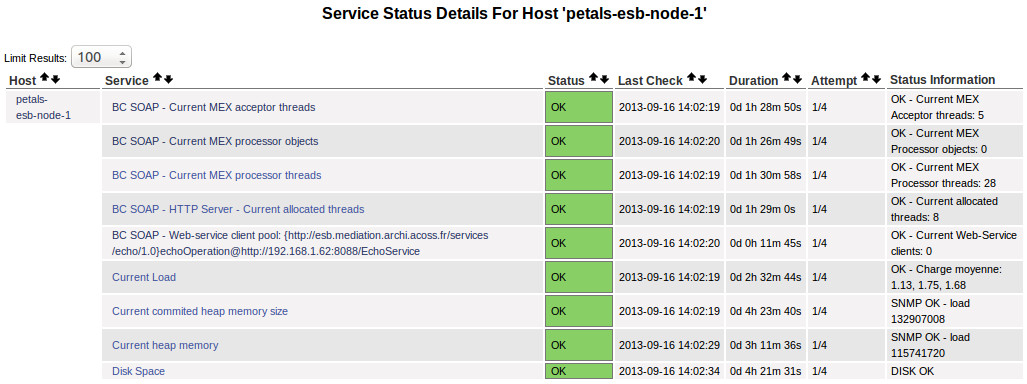
Defining your Petals ESB hosts
For each Petals ESB node of your Petals ESB topology, create an instance of the template 'petals-esb-host':
define host{
        use                     petals-esb-host            ; Name of host template to use
        host_name               petals-esb-node-1
        alias                   Petals ESB Node 1
        address                 127.0.0.1
# Specific attributes: Uncomment to specify a value different from the default one
#        _snmpport                       16161          ; Listening port of the JVM SNMP agent
#        _jmxport                        7700           ; Listening port of the Petals JMX agent
#        _jmxuser                        petals         ; JMX credentials: username
#        _jmxpassword                    petals         ; JMX credentials: password
        }

define host{
        use                     petals-esb-host            ; Name of host template to use
        host_name               petals-esb-node-2
        alias                   Petals ESB Node 2
        address                 192.168.1.25
# Specific attributes: Uncomment to specify a value different from the default one
#        _snmpport                       16161          ; Listening port of the JVM SNMP agent
#        _jmxport                        7700           ; Listening port of the Petals JMX agent
#        _jmxuser                        petals         ; JMX credentials: username
#        _jmxpassword                    petals         ; JMX credentials: password
        }
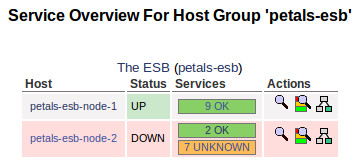
Defining your Petals ESB topology as a Petals ESB host group
The Petals ESB topology can be considered as a Nagios host group composed of your Petals ESB nodes:
define hostgroup {
        hostgroup_name  petals-esb
        alias           The ESB
        members         petals-esb-node-1, petals-esb-node-2
        }
Petals ESB host services
We group all Petals ESB host services:
define servicegroup{
        servicegroup_name       petals-services
        alias                   Petals ESB Services
}
A best practice to monitor Petals ESB nodes is to create a template of services to associate to each Petals ESB nodes:
# Define a service to check the disk space of the partitions
# Warning if < 20% free, critical if < 10% free space on partition.
# Adapt the last parameter of "check_disk" to check only the
# partitions where dynamic data (as log files, repository) are
# written by petals (/var/lib/petals-esb, /var/log/petals-esb).
# Probably two services will be required with different thresholds.
define service{
        use                             generic-service
        hostgroup_name                  petals-esb
        service_description             Disk Space
        check_command                   check_disk!20%!10%!/var
        servicegroups                   petals-services
        contact_groups                  petals-esb
}


# Define a service to check the load on the local machine.
define service{
        use                             generic-service
        hostgroup_name                  petals-esb
        service_description             Current Load
        check_command                   check_load!5.0!4.0!3.0!10.0!6.0!4.0
        servicegroups                   petals-services
        contact_groups                  petals-esb
}

# Define a service to check the heap memory used by Petals ESB node.
# Warning if > 85% configured max heap size, critical if  95% configured
# max heap size.
# Note: The value returned by the SNMP Get is a byte value. So, for
# a max heap size of 1Go:
#     85% => 912680550 bytes,
# and 95% => 1020054733 bytes
define service{
        use                             generic-service
        hostgroup_name                  petals-esb
        service_description             Current heap memory
        check_command                   jvm_heapused!public!2c!912680550!1020054732
        servicegroups                   petals-services
        contact_groups                  petals-esb
}

# Define a service to check the max (commited) heap memory used by Petals ESB node.
# Warning if > Warning if > 85% configured max heap size, critical if  95% configured
# max heap size.
# Note: The value returned by the SNMP Get is a byte value. So, for
# a max heap size of 1Go:
#     85% => 912680550 bytes,
# and 95% => 1020054733 bytes
define service{
        use                             generic-service
        hostgroup_name                  petals-esb
        service_description             Current commited heap memory size
        check_command                   jvm_heapmaxused!public!2c!912680550!1020054732
        servicegroups                   petals-services
        contact_groups                  petals-esb
}
Petals BC SOAP configuration
Active checks
To check the health of the BC SOAP, you can add several services to check:
- the current number of active thread of the HTTP thread pool.
- the outgoing web-service client pools,
- the message exchange acceptor pool,
- the message exchange processors,
- the message exchange processor thread pool.
All these checks are grouped in the following configuration that you can put in the directory /etc/nagios3/conf.d.
The configuration uses a Nagios plugin wrapping Petals CLI: check_petals_bcsoap. You can get a such plugin here and put it in your directory /usr/lib/nagios/plugins.
| The Nagios plugin for Petals requires having installed Petals CLI using Debian package, or having the Petals CLI in your path |
Checking the current number of active threads of the HTTP thread pool
########################################################
#### Dedicated commands to monitor a Petals BC SOAP ####
########################################################

#
# Monitoring of the current active threads of the HTTP server thread pools
#
define command{
	command_name	petals_bcsoap_httpthreadpool_currentactivethreads
	command_line	/usr/lib/nagios/plugins/check_petals_bcsoap -h '$HOSTADDRESS$' -n '$_HOSTJMXPORT$' -u '$_HOSTJMXUSER$' -p '$_HOSTJMXPASSWORD$' --http-thread-pool-current-active-threads -i '$ARG1$' -w '$ARG2$' -c '$ARG3$'
}

# Define a service to check the HTTP Thread pool of the Petals BC SOAP against the current
# active thread number.
# According to default value: Warning if > 40, critical if > 45.
define service{
        use                             generic-service
        hostgroup_name                  petals-esb
        service_description             BC SOAP - HTTP Server - Current active threads
        display_name                    Petals BC SOAP - HTTP Thread Pool - Current active thread
        check_command                   petals_bcsoap_httpthreadpool_currentactivethreads!petals-bc-soap!40!45
	servicegroups			petals-services
        contact_groups                  petals-esb
}
Checking the web-service client pool of a service operation
#
# Monitoring of the current web-service client pool of a service operation
#
define command{
   command_name   petals_bcsoap_ws-client-pool
   command_line   /usr/lib/nagios/plugins/check_petals_bcsoap -h '$HOSTADDRESS$' -n '$_HOSTJMXPORT$' -u '$_HOSTJMXUSER$' -p '$_HOSTJMXPASSWORD$' --outgoing_ws_clients -i '$ARG1$' -o '$ARG2$' -w '$ARG3$' -c '$ARG4$'
}

# Define a service to check the web-service client pool of a service operation.
# According to default value: Warning if > 40, critical if > 45.
define service{
        use                   generic-service
        hostgroup_name        petals-esb
        service_description   BC SOAP - Web-service client pool: {http://esb.mediation.archi.acoss.fr/services/echo/1.0}echoOperation@http://192.168.1.62:8088/EchoService
        display_name          Petals BC SOAP - Web-service client pool: {http://esb.mediation.archi.acoss.fr/services/echo/1.0}echoOperation@http://192.168.1.62:8088/EchoService
        check_command         petals_bcsoap_ws-client-pool!petals-bc-soap!{http://esb.mediation.archi.acoss.fr/services/echo/1.0}echoOperation@http://192.168.1.62:8088/EchoService!40!45
        servicegroups         petals-services
        contact_groups        petals-esb
}
| The service operation for which the Nagios check must be verified is a parameter (ARG2) of the command. |
Checking the current number of message exchange acceptors
#
# Monitoring of the current message exchange acceptor thread
#
define command{
   command_name   petals_bcsoap_mex_current_acceptor_threads
   command_line   /usr/lib/nagios/plugins/check_petals_bcsoap -h '$HOSTADDRESS$' -n '$_HOSTJMXPORT$' -u '$_HOSTJMXUSER$' -p '$_HOSTJMXPASSWORD$' --mex_current_acceptor_threads -i '$ARG1$' -w '$ARG2$' -c '$ARG3$'
}

# Define a service to check the message exchange acceptor thread pool.
# According to default value: Warning if < 3, critical if < 2.
define service{
        use                   generic-service
        hostgroup_name        petals-esb
        service_description   BC SOAP - Current MEX acceptor threads
        display_name          Petals BC SOAP - Message exchange acceptor thread pool
        check_command         petals_bcsoap_mex_current_acceptor_threads!petals-bc-soap!3!2
        servicegroups         petals-services
        contact_groups        petals-esb
}
Checking the current number of message exchange processors
#
# Monitoring of the current message exchange processors
#
define command{
   command_name   petals_bcsoap_mex_current_processor_objects
   command_line   /usr/lib/nagios/plugins/check_petals_bcsoap -h '$HOSTADDRESS$' -n '$_HOSTJMXPORT$' -u '$_HOSTJMXUSER$' -p '$_HOSTJMXPASSWORD$' --mex_current_processor_objects -i '$ARG1$' -w '$ARG2$' -c '$ARG3$'
}

# Define a service to check the message exchange processor objects.
# According to default value: Warning if > 40, critical if > 45.
define service{
        use                   generic-service
        hostgroup_name        petals-esb
        service_description   BC SOAP - Current MEX processor objects
        display_name          Petals BC SOAP - Message exchange processor object pool
        check_command         petals_bcsoap_mex_current_processor_objects!petals-bc-soap!40!45
        servicegroups         petals-services
        contact_groups        petals-esb
}
Checking the message exchange processor thread pool
#
# Monitoring of the current message exchange processor threads
#
define command{
   command_name   petals_bcsoap_mex_current_processor_threads
   command_line   /usr/lib/nagios/plugins/check_petals_bcsoap -h '$HOSTADDRESS$' -n '$_HOSTJMXPORT$' -u '$_HOSTJMXUSER$' -p '$_HOSTJMXPASSWORD$' --mex_current_processor_threads -i '$ARG1$' -w '$ARG2$' -c '$ARG3$'
}

# Define a service to check the message exchange processor thread pool.
# According to default value: Warning if > 40, critical if > 45.
define service{
        use                   generic-service
        hostgroup_name        petals-esb
        service_description   BC SOAP - Current MEX processor threads
        display_name          Petals BC SOAP - Message exchange processor thread pool
        check_command         petals_bcsoap_mex_current_processor_threads!petals-bc-soap!40!45
        servicegroups         petals-services
        contact_groups        petals-esb
}
Passive check
The probes available in the Petals internals and components are able to send JMX notifications when they detect a defect. These notifications can be sent to Nagios with a dedicated monitoring command of Petals CLI that receive JMX notifications and write them in the channel of Nagios passive checks.
See Receiving Petals ESB defects in Nagios to get more information.
Restart Nagios
Restart your Nagios service to take into account the configuration:
sudo service nagios3 restart