IntroductionAll components based on the Petals Component Development Kit provide following metrics:
|
Table of contents
Contributors
No contributors found for: authors on selected page(s)
|
Monitoring the provider side
Monitoring the message exchange acceptor thread pool
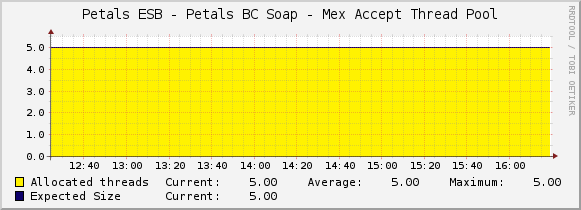
See Creating a graph using a simple data to graph the stats of the thread pool accepting message exchanges:
- Script/Command of the data input method: petals-cli.sh -h <petals_host> -n <petals_jmx_port> -u <petals_jmx_user> -p <petals_jmx_password> -c -- monitoring -o generic -f mex-acceptor-thread-pool -- -n <component-id>
- Output fields of the script/command:
Name Description Type ActiveThreadsMax The maximum number of active threads GAUGE ActiveThreadsCurrent The current number of active threads GAUGE
Monitoring the message exchange processor thread pool
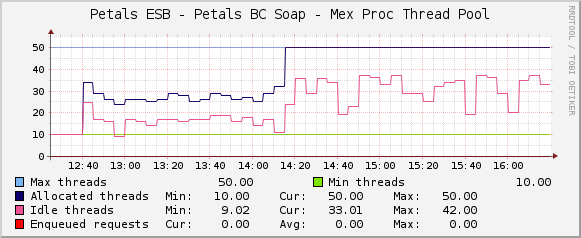
See Creating a graph using a simple data to graph the stats of the thread pool of message exchanges:
- Script/Command of the data input method: petals-cli.sh -h <petals_host> -n <petals_jmx_port> -u <petals_jmx_user> -p <petals_jmx_password> -c -- monitoring -o generic -f mex-processor-thread-pool -- -n <component-id>
- Output fields of the script/command:
Name Description Type ActiveThreadsMax The maximum number of active threads GAUGE ActiveThreadsCurrent The current number of active threads GAUGE IdleThreadsMax The maximum number of idle threads GAUGE IdleThreadsCurrent The current number of idle threads GAUGE MaxSize The maximum size of the thread pool GAUGE MinSize The minimum size of the thread pool GAUGE EnqueuedRequestsMax The maximum number of requests that are enqueued waiting a thread to be processed GAUGE EnqueuedRequestsCurrent The current number of requests that are enqueued waiting a thread to be processed GAUGE
Monitoring the service provider invocation number per operation and execution status
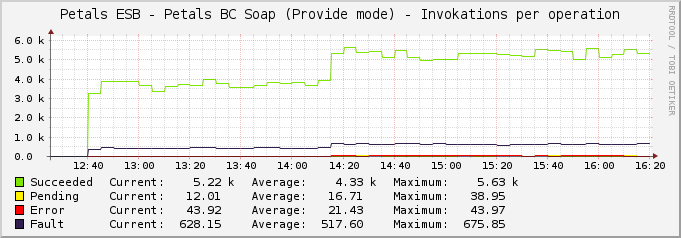
See Creating a graph using a data query to graph the stats about invocation number of a service provider:
- the data query definition to put in a file:
<interface>
        <name>Get service provider invocation number of the BC Soap per operation</name>
        <script_path>petals-cli.sh</script_path>
        <arg_prepend>-h localhost -n 7700 -u petals -p petals -c -- monitoring -o generic -f service-provider-invocations-count</arg_prepend>
        <arg_index>-- -n petals-bc-soap --list-operations</arg_index>
        <arg_query>-- -n petals-bc-soap --query-operations</arg_query>
        <arg_get>-- -n petals-bc-soap --query-operations</arg_get>
        <output_delimeter>!</output_delimeter>
        <index_order>filterName</index_order>
        <index_order_type>alphanumeric</index_order_type>
        <!--index_title_format>|chosen_order_field|</index_title_format-->

        <fields>
                <filterName>
                        <name>Operation name</name>
                        <direction>input</direction>
                        <query_name>NAME</query_name>
                </filterName>
                <succeeded>
                        <name>Succeeded invocation counter</name>
                        <direction>output</direction>
                        <query_name>SUCCEEDED</query_name>
                </succeeded>
                <error>
                        <name>Failed invocation counter</name>
                        <direction>output</direction>
                        <query_name>ERROR</query_name>
                </error>
                <fault>
                        <name>Faulty invocation counter</name>
                        <direction>output</direction>
                        <query_name>FAULT</query_name>
                </fault>
                <pending>
                        <name>Pending invocation counter</name>
                        <direction>output</direction>
                        <query_name>PENDING</query_name>
                </pending>
        </fields>
</interface>
- Output fields of the script/command:
Name Description Type succeeded The succeeded invocation counter COUNTER error The failed invocation counter COUNTER fault The faulty invocation counter COUNTER pending The pending invocation counter GAUGE
Monitoring the service provider invocation response times per operation and execution status
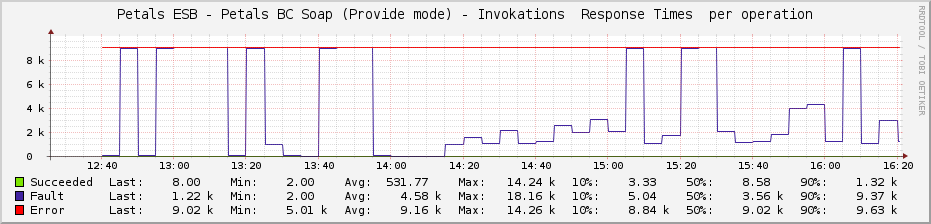
See Creating a graph using a data query to graph the stats about invocation response times of a service provider:
- the data query definition to put in a file:
<interface>
        <name>Get service provider invocation response times of the BC Soap per operation</name>
        <script_path>petals-cli.sh</script_path>
        <arg_prepend>-h localhost -n 7700 -u petals -p petals -c -- monitoring -o generic -f service-provider-invocations-response-times</arg_prepend>
        <arg_index>-- -n petals-bc-soap --list-operations</arg_index>
        <arg_query>-- -n petals-bc-soap --query-operations</arg_query>
        <arg_get>-- -n petals-bc-soap --query-operations</arg_get>
        <output_delimeter>!</output_delimeter>
        <index_order>filterName</index_order>
        <index_order_type>alphanumeric</index_order_type>
        <!--index_title_format>|chosen_order_field|</index_title_format-->

        <fields>
                <filterName>
                        <name>Operation name</name>
                        <direction>input</direction>
                        <query_name>NAME</query_name>
                </filterName>
                <succeededMin>
                        <name>Succeeded invocation: Min response time</name>
                        <direction>output</direction>
                        <query_name>SUCCEEDED_MIN</query_name>
                </succeededMin>
                <succeededAvg>
                        <name>Succeeded invocation: Avg response time</name>
                        <direction>output</direction>
                        <query_name>SUCCEEDED_AVG</query_name>
                </succeededAvg>
                <succeededMax>
                        <name>Succeeded invocation: Max response time</name>
                        <direction>output</direction>
                        <query_name>SUCCEEDED_MAX</query_name>
                </succeededMax>
                <succeeded10p>
                        <name>Succeeded invocation: 10-percentil response time</name>
                        <direction>output</direction>
                        <query_name>SUCCEEDED_10P</query_name>
                </succeeded10p>
                <succeeded50p>
                        <name>Succeeded invocation: 50-percentil response time</name>
                        <direction>output</direction>
                        <query_name>SUCCEEDED_50P</query_name>
                </succeeded50p>
                <succeeded90p>
                        <name>Succeeded invocation: 90-percentil response time</name>
                        <direction>output</direction>
                        <query_name>SUCCEEDED_90P</query_name>
                </succeeded90p>
                <pendingMin>
                        <name>Pending invocation: Min response time</name>
                        <direction>output</direction>
                        <query_name>PENDING_MIN</query_name>
                </pendingMin>
                ...
                <errorMin>
                        <name>Failed invocation: Min response time</name>
                        <direction>output</direction>
                        <query_name>ERROR_MIN</query_name>
                </errorMin>
                ...
                <faultMin>
                        <name>Faulty invocation: Min response time</name>
                        <direction>output</direction>
                        <query_name>FAULT_MIN</query_name>
                </faultMin>
        </fields>
</interface>
- Output fields of the script/command:
Name Description Type succeededMin The min response time of succeeded invocations GAUGE succeededAvg The average response time of succeeded invocations GAUGE succeededMax The max response time of succeeded invocations GAUGE succeeded10p The 10-percentil response time of succeeded invocations GAUGE succeeded50p The 50-percentil response time of succeeded invocations GAUGE succeeded90p The 90-percentil response time of succeeded invocations GAUGE pendingMin The min response time of pending invocations GAUGE pendingAvg The average response time of pending invocations GAUGE pendingMax The max response time of pending invocations GAUGE pending10p The 10-percentil response time of pending invocations GAUGE pending50p The 50-percentil response time of pending invocations GAUGE pending90p The 90-percentil response time of pending invocations GAUGE errorMin The min response time of failed invocations GAUGE errorAvg The average response time of failed invocations GAUGE errorMax The max response time of failed invocations GAUGE error10p The 10-percentil response time of failed invocations GAUGE error50p The 50-percentil response time of failed invocations GAUGE error90p The 90-percentil response time of failed invocations GAUGE faultMin The min response time of faulty invocations GAUGE faultAvg The average response time of faulty invocations GAUGE faultMax The max response time of faulty invocations GAUGE fault10p The 10-percentil response time of faulty invocations GAUGE fault50p The 50-percentil response time of faulty invocations GAUGE fault90p The 90-percentil response time of faulty invocations GAUGE