|
Prometheus is an open-source systems monitoring and alerting toolkit. ? Prometheus scrapes metrics from instrumented jobs, either directly or via an intermediary push gateway for short-lived jobs. It stores all scraped samples locally and runs rules over this data to either aggregate and record new time series from existing data or generate alerts. Grafana or other API consumers can be used to visualize the collected data. Prometheus's main features are:
|
Table of contents
Contributors
No contributors found for: authors on selected page(s)
|
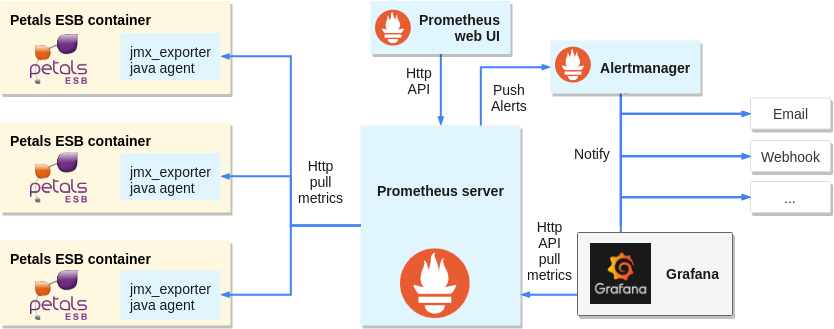
Connecting to Petals JMX
Petals exposes its metrics on JMX, but Prometheus itself cannot natively gather metrics through JMX. So we need to expose those metrics on HTTP, which Prometheus can access.
Luckily Prometheus maintains jmx_exporter which exposes metrics on HTTP. It can either act as a java agent injected into the JVM during Petals ESB startup or an independent server connecting to Petals ESB by RMI.
Installing jmx_exporter as java agent:
From Prometheus documentation:
JMX to Prometheus exporter: a collector that can configurably scrape and expose MBeans of a JMX target.
This exporter is intended to be run as a Java Agent, exposing a HTTP server and serving metrics of the local JVM. It can be also run as an independent HTTP server and scrape remote JMX targets, but this has various disadvantages, such as being harder to configure and being unable to expose process metrics (e.g., memory and CPU usage). Running the exporter as a Java Agent is thus strongly encouraged.
- Copy jmx_prometheus_javaagent-XXX.jar in petals-esb-directory/lib folder
- Create a yaml config file in petals-esb-directory/conf folder, here it is named prometheus-jmx.yaml. The file can be empty for now, but this default config will display everything available:
startDelaySeconds: 0 rules: - pattern: ".*" - Add the following line to petals-esb.sh, just before the “exec” command at the very end of the script. If necessary, change the version number to match the jar file you downloaded. 8585 is the port number on which HTTP metrics will be exposed (once gathered by the jmx_exporter), set it as you see fit.
JAVA_OPTS="$JAVA_OPTS -javaagent:${PETALS_LIB_DIR}/jmx_prometheus_javaagent-0.3.1.jar=8585:${PETALS_CONF_DIR}/prometheus-jmx.yaml" - Run petals-esb.sh
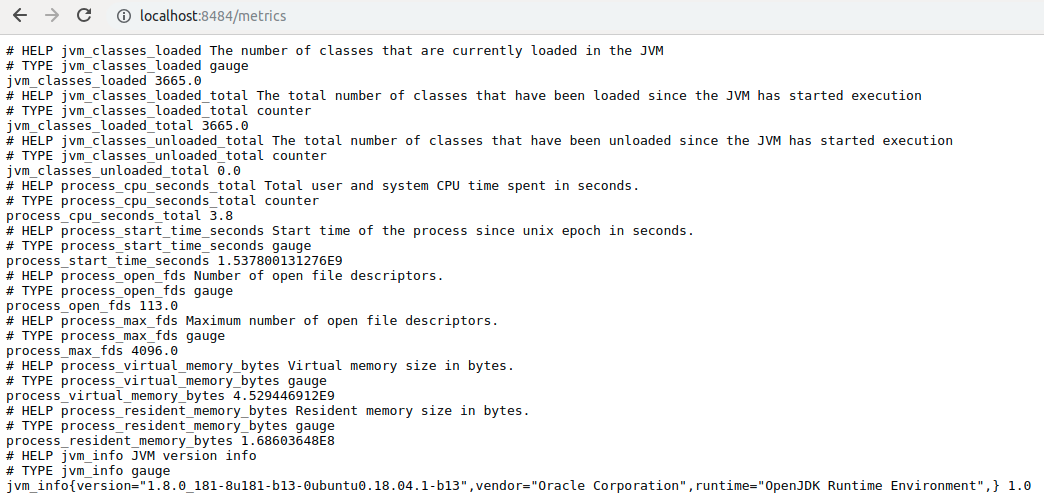
- Metrics are available at http://localhost:8585/metrics
?Raw metrics sample:
Alternate jmx_exporter install: as HTTP server
- Download jmx_prometheus_httpserver. Be careful about the confusing version number, check the date to have the last version.
- Adapt the prometheus-jmx.yaml config file to connect by RMI. You can use either jmxUrl or hostPort, username and password are mandatory.
startDelaySeconds: 0

# jmxUrl: service:jmx:rmi:///jndi/rmi://localhost:7700/PetalsJMX
hostPort: localhost:7700
username: petals
password: petals

rules:
 - pattern: ".*"
- Start the server, with the exposition HTTP ip:port and config file as argument:
java \-jar jmx_prometheus_httpserver-0.3.1-jar-with-dependencies.jar localhost:8585 prometheus-jmx.yaml
Install Prometheus
- Install: https://prometheus.io/docs/prometheus/latest/getting_started/
- Configure Prometheus, here is a sample prometheus.yml config:
global: scrape_interval: 5s evaluation_interval: 5s scrape_configs: # The job name is added as a label `job=<job_name>` to any timeseries scraped from this config. - job_name: 'petals monitoring' # metrics_path defaults to '/metrics' # scheme defaults to 'http'. static_configs: - targets: ['localhost:8585'] labels: container: 'petals-sample-0' - Start Prometheus:
./prometheus --config.file=prometheus.yml
Configuring jmx agent
Jmx agent can be configured in its yaml config file.
| Be wary that Petals ESB anterior to version 5.3.0 exposes MBeans as complex Java types (such as Maps and Lists), which are not compatible with the jmx agent and will be ignored. In later versions this was reworked to expose MBeans as standard OpenMBean format (ComplexData and TabularData), which is natively compatible with the agent. It is advised to upgrade to Petals 5.3.0 (or later) to avoid compatibility issues and enable all metrics straight out of the box. |
Note that:
- Only numeric values are supported by Prometheus, complex types will be splitted in single numeric values by the agent. Strings can be interpreted as regexp to extract numeric values, or be stored as string labels under an arbitraty numeric value (a somewhat risky workaround for a temporal DB).
- Custom and complex objects (other than OpenMBeans) may not be exported by the exporter, having ‘- pattern “.”’ as only rule will return every metric available* (useful for testing or default rule).
- Rules order is important: Eventually, a single MBean attributes is processed by a single rule! To decide which rule is applied: MBean attributes will be parsed by each rule (in order) until a pattern matches, then this rule is applied to the MBean attribute. In other words, all rules are tested against each MBean attribute the first one to match is kept for the attribute. So very specific rules should be put first, and generic/default rules last.
- Prometheus can make extensive use of labels through queries to determine metrics sources. Think about your needs when designing your labels, more explanations on the official documentation or this blog post.
- Metrics can be typed (conceptually, as gauge, counter or histogram) for Prometheus to know how to handle them. More details on the official documentation.
- Metrics format:
<metric name>{<label name>=<label value>, ...}
Be careful passing strings as labels (quote from Pierre Vincent's blog):
A word on label cardinality
Labels are really powerful so it can be tempting to annotate each metric with very specific information, however there are some important limitations to what should be used for labels.Prometheus considers each unique combination of labels and label value as a different time series. As a result if a label has an unbounded set of possible values, Prometheus will have a very hard time storing all these time series. In order to avoid performance issues, labels should not be used for high cardinality data sets (e.g. Customer unique ids).
Filter Petals metrics
The exporter will by default expose everything available at JVM level. Some JVM metrics will always be exposed, most of them can by filtered out using a black list and/or a white list (black list takes precedence). The following white list will produce only Petals custom and general metrics:
whitelistObjectNames:
  - "org.ow2.petals*:*"
  - "Petals*:*"
Configuration samples:
The following samples are produced monitoring a Petals ESB single container topology hosting 3 components (SOAP, REST and Camel).
Raw metrics can be hard to exploit, as the exporter automatically creates metrics:
Wildcard pattern rule:
rules:
- pattern: ".*"
Raw metrics sample:
# metric: java.lang<type=OperatingSystem><>SystemCpuLoad
java_lang_OperatingSystem_SystemCpuLoad 0.10240228944418933

# metric: java.lang<type=OperatingSystem><>ProcessCpuLoad
java_lang_OperatingSystem_ProcessCpuLoad 3.158981547513337E-4

# metrics: org.ow2.petals<type=custom, name=monitoring_petals-(se-camel | bc-soap | bc-rest)><>MessageExchangeProcessorThreadPoolQueuedRequestsMax)
org_ow2_petals_custom_MessageExchangeProcessorThreadPoolQueuedRequestsMax{name="monitoring_petals-se-camel",} 0.0
org_ow2_petals_custom_MessageExchangeProcessorThreadPoolQueuedRequestsMax{name="monitoring_petals-bc-soap",} 0.0
org_ow2_petals_custom_MessageExchangeProcessorThreadPoolQueuedRequestsMax{name="monitoring_petals-bc-rest",} 0.0
In this case, we cannot know later in Prometheus where the metrics originated or which Petals ESB container is concerned. By adding a few generic rules, we can add label and control the metric names.
Adding generic rules
In this example, the point of our rules is:
- gather java.lang metrics, name the metric with the explicit MBean and label them by type.
- gather component metrics, name the metric with the explicit MBean, and label in a usable way component and type (monitoring or runtime_configuration).
Generic rules samples:
rules:
- pattern: 'java.lang<type=(.+)><>(.+): (.+)'
  name: "$2"
  value: "$3"
  labels:
    type: "$1"

- pattern: 'org.ow2.petals<type=custom, name=monitoring_(.+)><>(.+): (.+)'
  name: "$2"
  value: "$3"
  labels:
    type: "monitoring"
    component: "$1"

- pattern: 'org.ow2.petals<type=custom, name=runtime_configuration_(.+)><>(.+): (.+)'
  name: "$2"
  value: "$3"
  labels:
    type: "runtime_config"
    component: "$1"
Metrics parsed by generic rules:
ProcessCpuLoad{type="OperatingSystem",} 2.5760609293017057E-4
SystemCpuLoad{type="OperatingSystem",} 0.10177234194298118

MessageExchangeProcessorThreadPoolQueuedRequestsMax{component="petals-bc-soap",type="monitoring",} 0.0
MessageExchangeProcessorThreadPoolQueuedRequestsMax{component="petals-se-camel",type="monitoring",} 0.0
MessageExchangeProcessorThreadPoolQueuedRequestsMax{component="petals-bc-rest",type="monitoring",} 0.0
Adding specific rules
And you can go further by adding rules for specific MBeans. Here we will
- group SystemCpuLoad and ProcessCpuLoad as a single metric.
- rename MessageExchangeProcessorThreadPoolQueuedRequestsMax into a shorter metric, while keeping the full name as label and helper.
 - pattern: 'java.lang<type=OperatingSystem><>SystemCpuLoad: (.*)'
   name: CpuLoad
   value: "$1"
   labels:
     type: "OperatingSystem"
     target: "system"

 - pattern: 'java.lang<type=OperatingSystem><>ProcessCpuLoad: (.*)'
   name: CpuLoad
   value: "$1"
   labels:
     type: "OperatingSystem"
     target: "process"

 - pattern: 'org.ow2.petals<type=custom, name=monitoring_(.+)><>MessageExchangeProcessorThreadPoolQueuedRequestsMax: (.+)'
   name: "MEPTP_QueuedRequests_Max"
   value: "$2"
   help: "MessageExchangeProcessorThreadPoolQueuedRequestsMax"
   labels:
     type: "monitoring"
     mbean: "MessageExchangeProcessorThreadPoolQueuedRequestsMax"
     component: "$1"
Metrics parsed by advanced rules:
CpuLoad{target="system",type="OperatingSystem",} 0.10234667681404555
CpuLoad{target="process",type="OperatingSystem",} 2.655985589352835E-4

MEPTP_QueuedRequests_Max{component="petals-bc-soap",mbean="MessageExchangeProcessorThreadPoolQueuedRequestsMax",type="monitoring",} 0.0
MEPTP_QueuedRequests_Max{component="petals-se-camel",mbean="MessageExchangeProcessorThreadPoolQueuedRequestsMax",type="monitoring",} 0.0
MEPTP_QueuedRequests_Max{component="petals-bc-rest",mbean="MessageExchangeProcessorThreadPoolQueuedRequestsMax",type="monitoring",} 0.0
You can mix generic and specific patterns, but remember that they are applied in order, so always put specific rules first!
Configuring Prometheus
Configuration file
Prometheus can be configured to connect statically or dynamically to metrics sources, these configurations are under the scrape_configs section of the yaml config file.
Depending on how you manage you machines, Prometheus can be connecter dynamically to several services systems including: Azure, Consul, EC2, OpenStack, GCE, Kubernetes, Marathon, AirBnB's Nerve, Zookeeper Serverset, Triton.
You can also rely on a DNS-based service discovery system allowing specifying a set of DNS domain names which are periodically queried to discover a list of targets.
Here we are going to demonstrate static configuration (static_configs), specifying a set of targets with direct connection. Note that they can be factored in a file, using file_std_config )
For the following sample, we are connecting to 2 petals container instances, both are running locally on ports 8585 and 8686.
Sample static config:
scrape_configs:
  - job_name: 'petals monitoring'

    static_configs:

    - targets: ['localhost:8585']
      labels:
        container: 'petals-sample-0'

    - targets: ['localhost:8686']
      labels:
        container: 'petals-sample-1'
We are labeling each one individually, to help differentiating them. Prometheus will add the labels, job-names from the config and also an instance one for each source. This produces in Prometheus interface the following metrics (keeping on with our previous examples):
CpuLoad{container="petals-sample-0",instance="localhost:8585",job="petals monitoring",target="process",type="OperatingSystem"}	0.007285089849441476
CpuLoad{container="petals-sample-0",instance="localhost:8585",job="petals monitoring",target="system",type="OperatingSystem"}	0.2049538610976202
CpuLoad{container="petals-sample-1",instance="localhost:8686",job="petals monitoring",target="process",type="OperatingSystem"}	0.022037218413320275
CpuLoad{container="petals-sample-1",instance="localhost:8686",job="petals monitoring",target="system",type="OperatingSystem"}	0.22624877571008814

MEPTP_QueuedRequests_Max{component="petals-bc-rest",container="petals-sample-0",instance="localhost:8585",job="petals monitoring",mbean="MessageExchangeProcessorThreadPoolQueuedRequestsMax",type="monitoring"}	0
MEPTP_QueuedRequests_Max{component="petals-bc-rest",container="petals-sample-1",instance="localhost:8686",job="petals monitoring",mbean="MessageExchangeProcessorThreadPoolQueuedRequestsMax",type="monitoring"}	0
MEPTP_QueuedRequests_Max{component="petals-bc-soap",container="petals-sample-0",instance="localhost:8585",job="petals monitoring",mbean="MessageExchangeProcessorThreadPoolQueuedRequestsMax",type="monitoring"}	0
MEPTP_QueuedRequests_Max{component="petals-bc-soap",container="petals-sample-1",instance="localhost:8686",job="petals monitoring",mbean="MessageExchangeProcessorThreadPoolQueuedRequestsMax",type="monitoring"}	0
MEPTP_QueuedRequests_Max{component="petals-se-camel",container="petals-sample-0",instance="localhost:8585",job="petals monitoring",mbean="MessageExchangeProcessorThreadPoolQueuedRequestsMax",type="monitoring"}	0
MEPTP_QueuedRequests_Max{component="petals-se-camel",container="petals-sample-1",instance="localhost:8686",job="petals monitoring",mbean="MessageExchangeProcessorThreadPoolQueuedRequestsMax",type="monitoring"}	0
There is also the option to define multiple instances in the same targets list:
scrape_configs:
  - job_name: 'petals monitoring'

    static_configs:

    - targets: ['localhost:8585','localhost:8686']
      labels:
        container: 'petals-samples'
CpuLoad{container="petals-samples",instance="localhost:8585",job="petals monitoring",target="process",type="OperatingSystem"}	0.007285089849441476
CpuLoad{container="petals-samples",instance="localhost:8585",job="petals monitoring",target="system",type="OperatingSystem"}	0.2049538610976202
CpuLoad{container="petals-samples",instance="localhost:8686",job="petals monitoring",target="process",type="OperatingSystem"}	0.022037218413320275
CpuLoad{container="petals-samples",instance="localhost:8686",job="petals monitoring",target="system",type="OperatingSystem"}	0.22624877571008814
More information on ??Prometheus documentation
Reload configuration
If the scraping configuration is not set dynamically, you can change the configuration and make Prometheus reload the file.
Remote command
There are two ways to ask Prometheus to reload it's configuration remotely:
Send a SIGHUP: determine the process id of Prometheus (look in 'var/run/prometheus.pid', or use tools as 'pgrep', 'ps aux | grep prometheus'). Then use the kill command to send the signal:
kill -HUP 1234
Or, send a HTTP POST to the Prometheus web server '/-/reload' handler:
curl -X POST http://localhost:9090/-/reload
Note: as of Prometheus 2.0, to reload over HTTP the_ '--web.enable-lifecycle'_ command line flag must be set.
In any case, Prometheus should acknowledge the reload:
level=info ts=2018-10-01T14:57:17.292032129Z caller=main.go:624 msg="Loading configuration file" filename=prometheus.yml
level=info ts=2018-10-01T14:57:17.293868363Z caller=main.go:650 msg="Completed loading of configuration file" filename=prometheus.yml
File configuration
As mentioned in the documentation on file configuration, using this method will allow to reload automatically and periodically.
Changes to all defined files are detected via disk watches and applied immediately. Files may be provided in YAML or JSON format. Only changes resulting in well-formed target groups are applied.
[. . .]
As a fallback, the file contents are also re-read periodically at the specified refresh interval.
Visualizing monitored metrics
Prometheus API
Prometheus server is reachable through its HTTP API. It allows to directly query metrics and can be useful in specific cases.
For instance, by requesting /api/v1/targets you can get an overview of configured targets and their health in json format.
request:
curl -X GET http://localhost:9090/api/v1/targets
response: prometheus_get-api-targets.json.
However there are simpler solutions, as a web UI already build in Prometheus server or open sources softwares natively compatible with this API (like Grafana).
Prometheus web UI
This UI is accessible connecting to prometheus server /graph, in our example:
http://localhost:9090/graph
This web UI allows you to enter any expression and see its result either in a table or graphed over time. This is primarily useful for ad-hoc queries and debugging.
But you can also view various prometheus server configuration (targets, rules, alerts, services discovery, etc...).
Grafana
Installing
Grafana installation is documented on Grafana website and setup for prometheus is documented on Prometheus website. It is advised to rely on these sources for an up to date installation.
- In short, install and run as standalone:
wget https://s3-us-west-2.amazonaws.com/grafana-releases/release/grafana-5.2.4.linux-amd64.tar.gz
tar -zxvf grafana-5.2.4.linux-amd64.tar.gz
cd grafana-5.2.4
./bin/grafana-server web
- Or as package:
Add the following line to your /etc/apt/sources.list file (even if you are on Ubuntu or another Debian version).deb https://packagecloud.io/grafana/stable/debian/ stretch mainThen run:
curl https://packagecloud.io/gpg.key | sudo apt-key add -
sudo apt-get update
sudo apt-get install grafana
sudo service grafana-server start
By default, Grafana web UI is available at localhost:3000, the default user is admin/admin.
Connecting to Prometheus
For an exhaustive documentation go to Grafana website
In short, once logged as admin:
- Open the side menu by clicking the Grafana icon in the top header.
- In the side menu under the Dashboards link you should find a link named Data Sources.
- Click the + Add data source button in the top header.
- Select Prometheus from the Type dropdown.
- Give a name to the data source
- Set the URL of prometheus server, in our example the default: localhost:9090
- Clic Save & Test
Note: Grafana data sources can also be configured by files
Creating a graph
Follow instructions from Grafana documentation to create a dashboard and add panels.
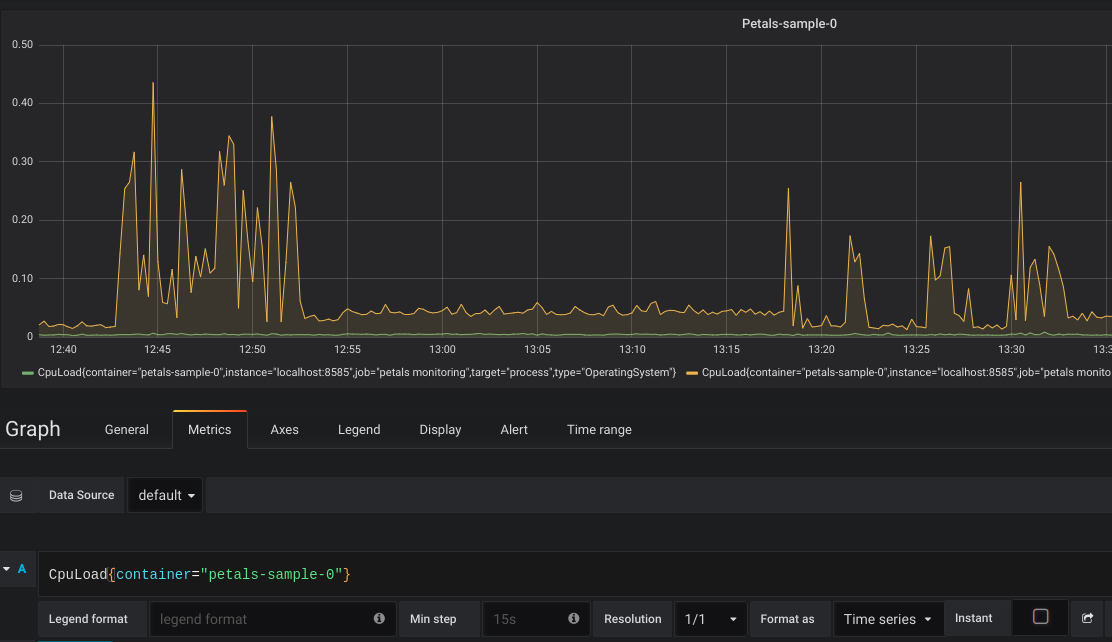
While editing a graph, in the metrics tab, you can use the same queries tested in Prometheus. For instance:
CpuLoad{container="petals-sample-0"}
Will display the CpuLoad metric only for petals-sample-0 container:
You can add different panel types that suit your need ton create your own tailored dashboard:
? 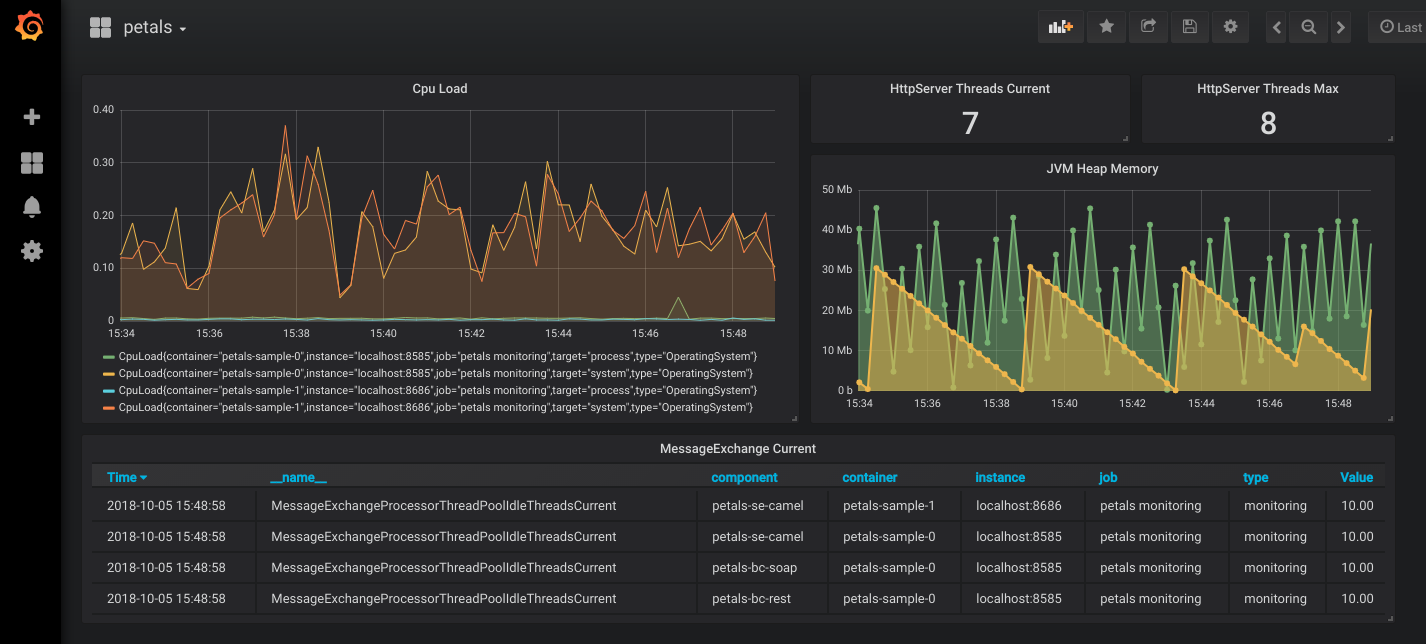
Importing our generic dashboards
The following dashboards are designed to display various relevant metrics about systems, containers, components and services. They require that :
- each container exposes metrics using a jmx agent (or HTTP server) using the wildcard pattern as configuration. The following rule and white list should reduce exported metrics to what's necessary for the dashboards (and Petals Monitoring in general).
whitelistObjectNames:
  - "org.ow2.petals*:*"
  - "Petals*:*"
  - "java.lang*:type=OperatingSystem,*"
  - "java.lang*:type=Memory,*"
  - "java.lang*:type=Threading,*"

rules:
  - pattern: ".*"
- prometheus is configured to scrape from each container, adding a specific "container" label to each one. Like this for example:
static_configs: - targets: ['<ip 1>:<port 1>'] labels: container: '<container 1 name>' - targets: ['<ip 2>:<port 2>'] labels: container: '<container 2 name>' - grafana server is configured to have prometheus available as datasource.
You can then download our dashboards:
Topology overview-1552482339462.json
Container overview-1552482360774.json
Components detail-1552482381216.json
API-1552482402292.json
All services-1552482428245.json
In grafana web UI, select "Import" in the "create" menu (the big + icon in left sidebar), then clic "Upload .json File".
? 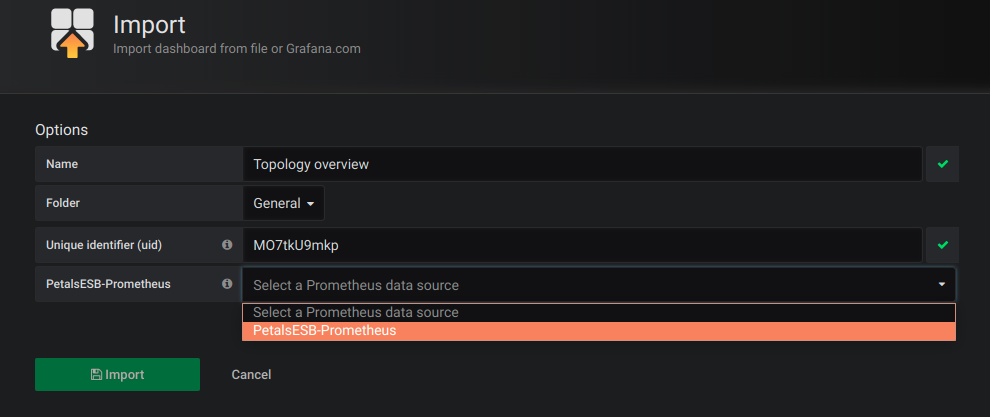
Do not forget to select your Prometheus instance as datasource!
Dashboards should be operational straight away, you may have to adapt the time range and reload each dashboard (by pressing F5) to force variables parsing though.
Alerting
Raising alerts and sending notifications can be configured in multiple ways, here we'll briefly cover these two:
- Prometheus can push alerts to Alertmanager which can notify through various channels
- Grafana can raise alerts and notify through various channels (including alertmanager)
We will provide examples to send email notifications.
Using Prometheus
Configuring rules
Prometheus can parse additional rule files, for this you must specify them in the prometheus configuration file:
# Load rules once and periodically evaluate them according to the global 'evaluation_interval'.
rule_files:
  - "alert_rules.yml"
And then configure alerts rules in this file, for instance :
groups:
- name: prometheus-alert-rules
  rules:
  - alert: TooManyErrors
    expr: ServiceProviderInvocations{executionStatus="ERROR"} > 10
    labels:
      severity: minor
    annotations:
      summary: Services were in error
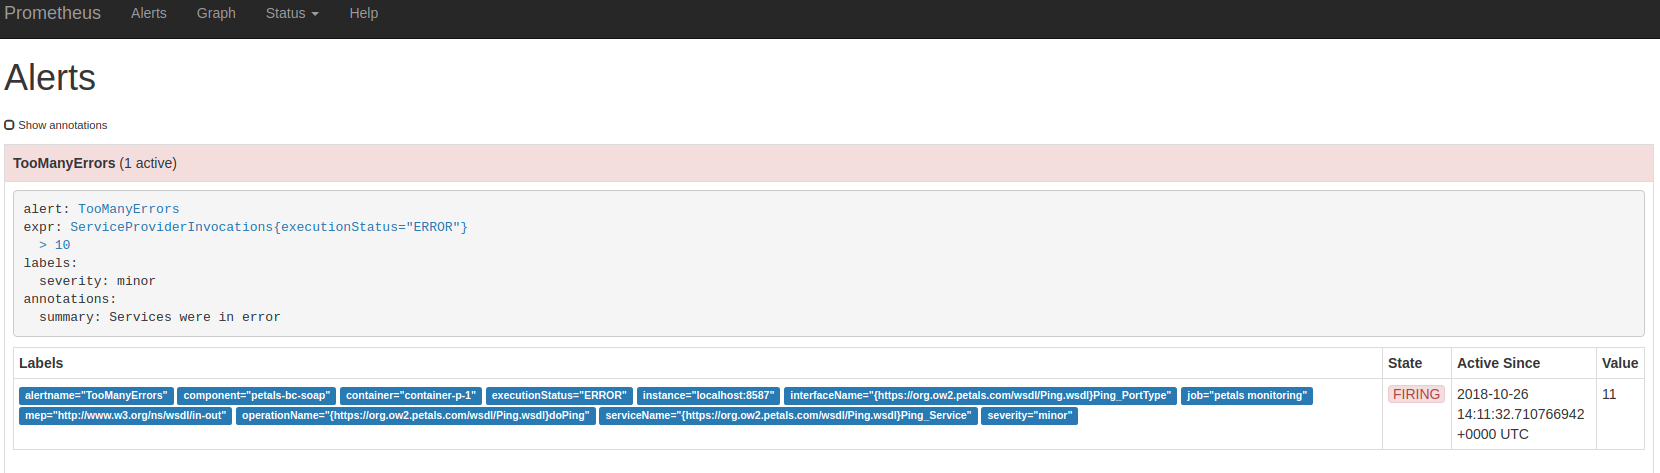
Then you can see the rule going to promtheus web UI. Here is an example of a triggered rule:
? 
Collecting in Alertmanager
The Alertmanager handles alerts sent by client applications such as the Prometheus server. It takes care of deduplicating, grouping, and routing them to the correct receiver integration such as email, PagerDuty, or OpsGenie. It also takes care of silencing and inhibition of alerts.
[...]
Alertmanager supports configuration to create a cluster for high availability.
To allow Prometheus to push alerts to Alertmanager, you must first provide an alertmanager url in Prometheus configuration. For instance, add these lines to prometheus configuration file :
alerting:
  alertmanagers:
  - scheme: http
    static_configs:
    - targets:
      - "localhost:9093"
Then, download Alertmanager, unzip it, and create an alertmanager.yml configuration file :
global:
  resolve_timeout: 5m

route:
  group_by: ['alertname']
  group_wait: 10s
  group_interval: 10s
  repeat_interval: 1h
  receiver: emails
receivers:
- name: emails
  email_configs:
  - to: administratorpetals@petals.com
    from: alertmanager@example.com
    smarthost: localhost:25
inhibit_rules:
  - source_match:
      severity: 'critical'
    target_match:
      severity: 'warning'
    equal: ['alertname', 'dev', 'instance']
Then, launch Alertmanager providing its configuration file :
./alertmanager --config.file=alertmanager.yml
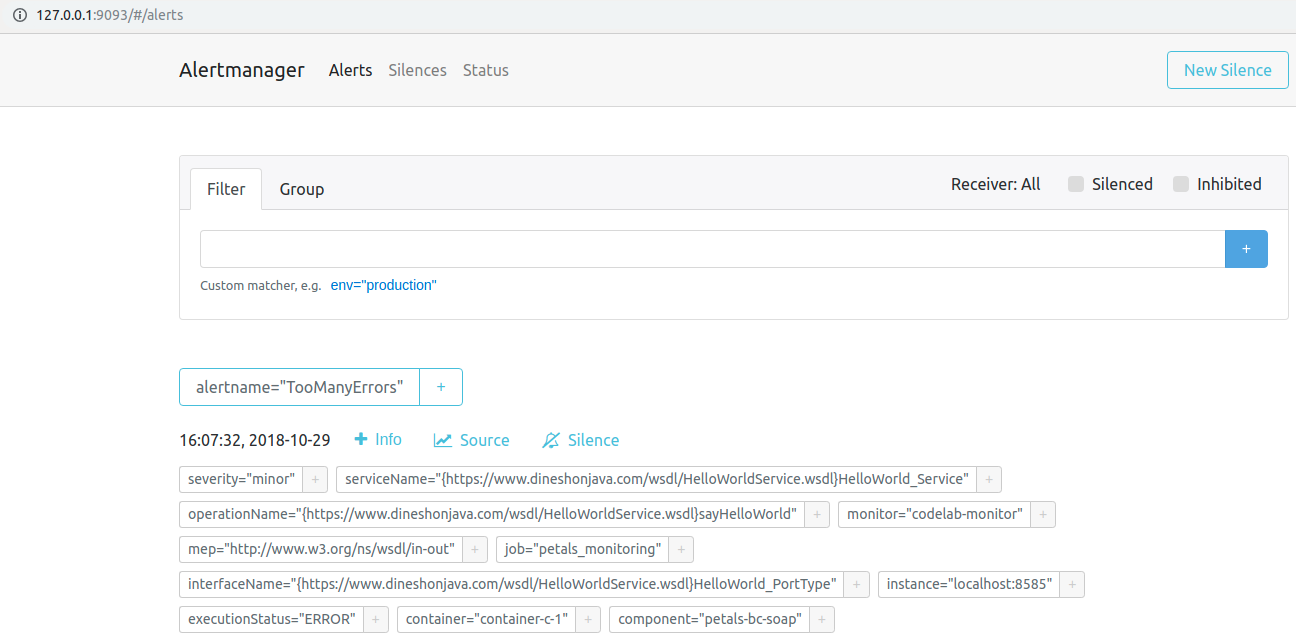
Alertmanager is now set up and awaiting alerts from prometheus to notify by email. You can check alerts on its web UI (exposed at 'http://127.0.0.1:9093/#/alerts' by default):
? 
using Grafana
First, you must create a notification channel through grafana UI (Bell icon on the left panel). In our example we'll use email :
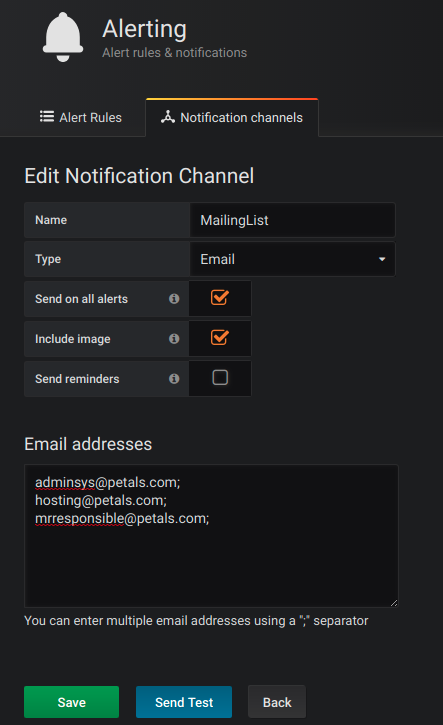
You may have to configure SMTP in grafana config file.
Then, go to your dashboard and create a graph panel for the desired metric. In our example we'll use the providers services in error:
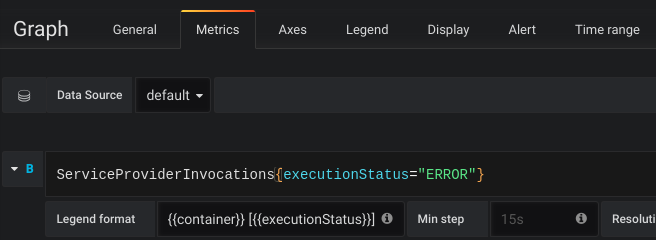
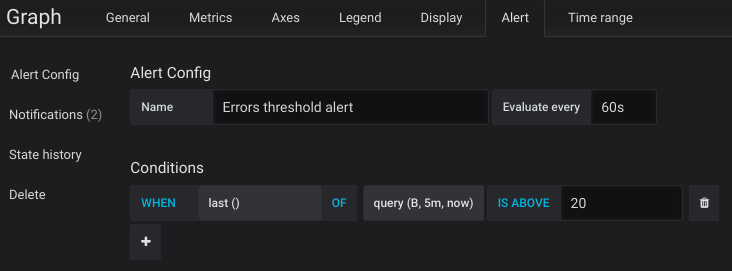
Then go to the "Alert" tab of this graph, and configure the alert conditions. Also remember to add the notification channel to the rule.
you will then receive an email if the alert is raised.