Filter management tab
Filter creation form
This form allows you to create different monitoring filter by playing with the
different form parameters.

The form provides several fields which may allow you to create different
monitoring filter configuration:
- Filter on the endpoint name.
- Filter on the interface name.
- Filter on the service name.
- Filter on the operation name.
Each previous parameter may not be used, in this case null value is assigned to the parameter
For example if you define a filter with null/null/null/null value for endpoint/service/interface/operation
parameters, upon activation of this filter all exchanges will be monitored by this filter.

![]() Warning: pay very attention with this king of filter, because monitoring all message exchanges
Warning: pay very attention with this king of filter, because monitoring all message exchanges
can seriously affect the speed, performance and overload on the Petals node where the filter is
activated.
Another important form parameter is the storage checkbox which allows you to declare a filter to
archive each message exchange caught.
Filter management table
This useful table allows you as this name mean to manage each declared filter. Each of them is
represented by a table row, which display several informations on the current filter:

Displayed informations are partly the same as those that you served in the monitoring creation filter form:
- Endpoint name.
- Interface name.
- Service name.
- Operation name.
- Stored exchange value
Other informations displayed is the current server where is declared the monitoring filter, and the monitoring
state of the filter enable/disabled, alterable by the following icons:
![]()
You can click on each icons to switch the current filter state, for example:
If a filter is disabled click on ![]() icon to active current filter on the associated
icon to active current filter on the associated
server, after that the monitoring enabled state icon will be displayed ![]() .
.
Finally, the following icon:  allows you to delete the current filter, if is enabled
on the associated server it's firstly disabled and then delete, instead if is
disabled it is directly delete from the monitoring filter table.
Two buttons are available on the top of filter table, the first button: 
allows you to export all filters of the list into CSV file. Example is displayed bellow:
| Endpoint | Interface | Operation | Service | Storage | Server | State | Change state | Delete |
|---|---|---|---|---|---|---|---|---|
| edpt-945EBEF356D7737C3E228882447520291 | {http://petals.ow2.org}Clock | {http://petals.ow2.org}printTime | {http://petals.ow2.org}ClockService | true | 0 | Enabled | Enabled | Delete |
| endpointPojo | {http://petals.ow2.org/}Pojo | null | {http://petals.ow2.org/}servicePojo | false | 0 | Disabled | Disabled | Delete |
The second button:
 allows you to import a previous
exported filter list. All filter will be in state with which they were imported.
Several examples:
- If filter-1 already exsist and is disabled on server but, it is enabled in csv file,
it will be enabled at the end of csv importation file.
- If filter-2 already exsist and is enabled on server but, it is disabled in csv file,
it will be disabled at the end of csv importation file.
- If filter-3 don't exsist on current server and it is enabled in csv file,
it will be enabled at the end of csv importation file.
- If filter-4 don't exsist on current server and it is disabled in csv file,
it will be disabled at the end of csv importation file.
| Container owner for monitoring filter Take attention, during an importation process only monitoring filters declared for the current container will be imported. For example if you try to import on container "0" a monitoring filter declared for container "1", the importation process don't import it. The container owner is the sixth column parameter, the title of column is "Server". |
Monitored filters tab
Monitored exchange filter
In this tab an table displays all message exchange caught by each declared filter on the current server.
Each row represent a declared filter and displays its linked informations like:
- Endpoint name.
- Interface name.
- Service name.
- Operation name.
- Storage value.

![]() Information: Each row own the following icon
Information: Each row own the following icon ![]() that allows you display more informations, on the current monitoring
that allows you display more informations, on the current monitoring
filter.
Many different informations are displayed like the number of monitored exchange for the filter, message exchanges
caught by the current filter.

The following form allows to set starting/ending dates, in order to define a time range where
the displayed exchanges will match the defined range.

The table which display message exchanges consists of three columns. The first
shows the message exchange id beginning with petals:uid:, the second column
correspond to the message exchange pattern and finally the last column contain
the following icon ![]() , which will server to show you the detailed view of each
, which will server to show you the detailed view of each
message exchange (a king of overview).
![]() Idea: another useful point in each monitoring filter row is the following icon
Idea: another useful point in each monitoring filter row is the following icon ![]() , which allows
, which allows
to display charts and diagrams representing exchange flows, exchange status, exchange
number ... of the current filter.
Charts & diagrams view
When you click on the ![]() icon a page linked to the current filter is displayed, in the top
icon a page linked to the current filter is displayed, in the top
of the page a form allows you to modify the window duration and the total duration of the
current monitoring view (int value representing second value).
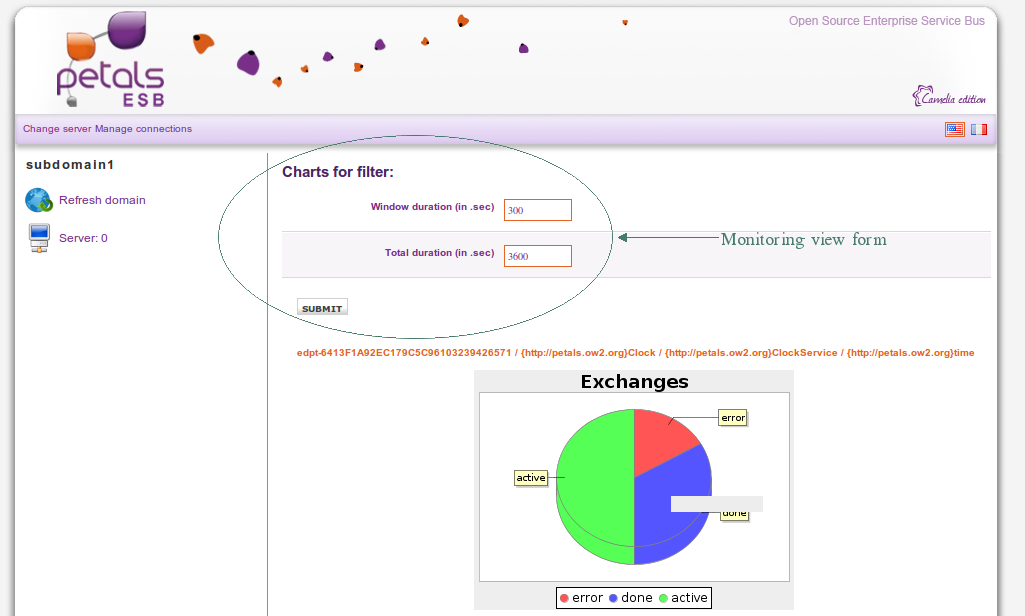
The first displayed chart present the different status of message exchanges caught by the
current filter:

![]() Information: You can spend on each chart part to know the percentage of the associated status,
Information: You can spend on each chart part to know the percentage of the associated status,
this feature can be useful to report to you if the service correctly processes message exchanges.
The diagram located on the bottom of the chart monitoring view page, present the exchanges flows
by an number exchange average for a specified time scale:

Four curves are displayed thank to this diagram:
- A blue curve that represent message exchanges with done status.
- A green curve that represent message exchanges with active status.
- A yellow curve that represent message exchanges in error status.
- A red curve that represent all message exchanges without taking into
account the different status.
The X,Y axis values are automatically adapted to the parameter values of the
monitoring view form.
![]() Information: This diagram can be considered as a sliding horizon, that mean your diagram
Information: This diagram can be considered as a sliding horizon, that mean your diagram
move to the left at each view update.

Exchanges overview page
This page is the most useful part of the monitoring, because it permits you to display all
informations of the current exchange that was caught by the monitoring filter. This large
page is composed of tree different parts, the first on top represent all global exchange
informations:

- The message exchange id beginning by petals:uid.
- The message exchange pattern.
- The exchange status.
- The endpoint name.
- The interface name.
- The service name.
- The operation name.
- The total exchange duration in millisecond of the exchange.
- The provider message processing duration in millisecond.
- The consumer message processing duration in millisecond.
- The beginning date of the exchange.
Also displayed in this part is the properties table of the current exchange with
two columns, in the first hand one for the property key and in other hand one
for property value:

The second page part is the most representative for the current exchange, which
consists to model the exchange sketch:
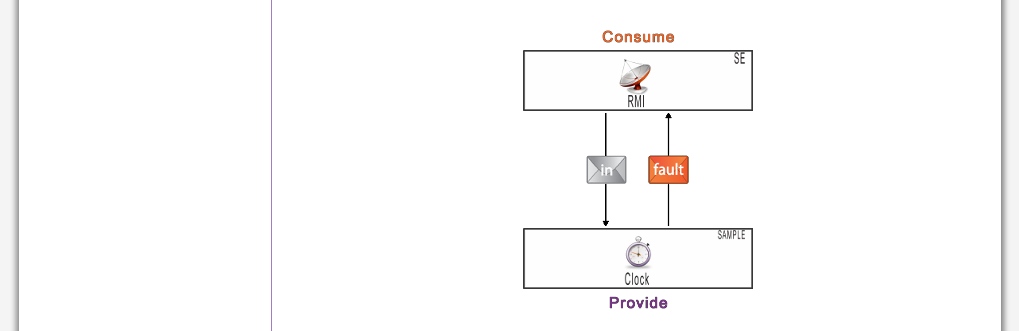
This draft displays the consumer component and the provider component, you can also know
the container holder just by passing you mouse over each component. If an unknown component
plays a role in the exchange, then an image of generic component will be displayed.
After that, several message types can be drawn according to the message exchange pattern:
| Message |
Meaning |
|---|---|
 |
This message type represent the IN message sent to begin the message exchange. |
 |
Message representing the OUT message sent during the message exchange. |
 |
DONE message type that represent the correctly finishing of the exchange. |
 |
This allow to model a FAULT message transited during the exchange. |
 |
That allows to display if an ERROR occurred during the exchange. |
The last overview part is located on the page bottom, this part displays each message
appeared during the exchange. Each displaying message have its own part which present
its associated informations:

- The message type.
- The message content.
- The total transfer duration of the exchange (in .ms).
- A table displaying key/value of each normalized message property.
- A table showing attachment name of each normalized message attachment.
Exchange and correlation searching
This new functionality it's very useful, because it's allows you to perform database searching
from a correlation identifier, either from an exchange message identifier.
The search is carried out on Petals ESB side, and if a result is returned to the Webconsole
it will be displayed.
The search may have a some impacts in your architecture, like late response, bad localisation
of informations but also more network traffic generation.
The result may be two different types:
- Searching error, which informs you that the search request doesn't
have found anything, both for the correlation identifier search or
exchange identifier search. - Searching result, if a correlation identifier search have have several
message exchanges as a result, one list of these message exchanges
will be displayed. If a search by message exchange identifier found only
one result, the overview page of this exchange will be displayed to you.
In the following screen you can provide a message exchange identifier in the searching
textbox, and select exchangeID for searching type.

After clicking on Submit if Petals ESB side return a result, you normally see the message
exchange overview (of the searching message exchange identifier) displayed by the Petals
Webconsole.

For the search by correlation identifier you just have to know the correlation id for the search you
want to achieve, set it in the searching textbox and select correlationID for searching parameter.

After clicking on Submit if Petals ESB side return a result, you normally see the list of all
message exchanges which are include in the same common flow (with the correlation
identifier of your previous searching request)
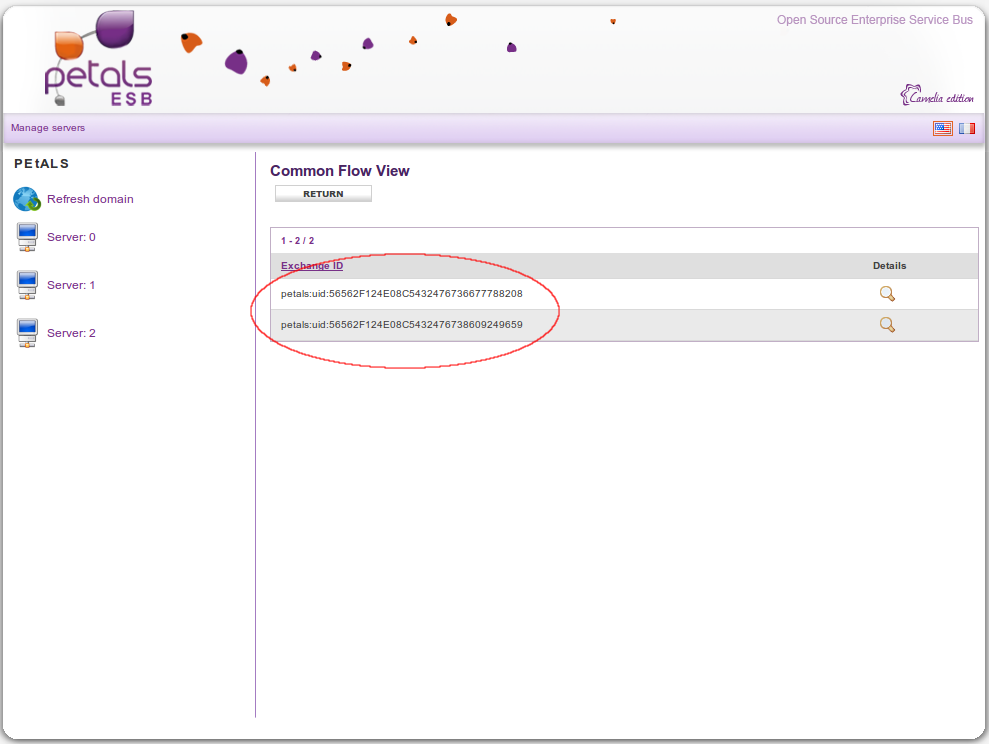
Common flow notions
In the Webconsole you have now the possibility to visualize several message exchange include
in the same common flow. For example if you have a use case that take in account several
message exchanges passing between the BC Filetransfert, EIP and BC SOAP, the common flow
will contain the globality of message exchanges transited between these components.

This function allows you to follow up the beginning of one use case activity until the end, by
visualizing all message exchanges transited during the process.