Installation
Cacti installation
The Cacti integration was experienced on a Linux distribution "Ubuntu Precise Pangolin (12.04)".
Cacti is available in version 0.8.7i through the default Ubuntu repository. So, just install the package "cacti" using the standard way.
Enabling the SNMP agents of the Petals ESB JVMs
As the monitoring tools can use SNMP probes to get information from the JVM running Petals ESB, we need to enable the SNMP agent of the JVM of each Petals ESB node. On each Petals node, in the environment configuration file, uncomment the system properties relative to the SNMP agent:
# Uncomment following lines to enable SNMP agent of the JVM
PETALS_JAVA_OPTS="$PETALS_JAVA_OPTS -Dcom.sun.management.snmp.port=16161"
PETALS_JAVA_OPTS="$PETALS_JAVA_OPTS -Dcom.sun.management.snmp.interface=0.0.0.0"
PETALS_JAVA_OPTS="$PETALS_JAVA_OPTS -Dcom.sun.management.snmp.acl.file=/etc/petals-esb/default-snmp.acl"
Adjust your SNMP port, interface and ACL.
| Caution, if Petals ESB runs with a user different from root, you need to use a port upper than 1024. To use a port lower than 1024 with a Petals ESB launches with a standard user, refers to the utility privbind (available in standard Ubuntu repository). |
| To use the same port on the same machine for several java processes, refers to snmpd used as proxy. |
| Caution, the ACL file should be accessible (read and write: 'chmod 600 xxx') only by the user running the JVM process. |
| If you use OpenJDK as Java virtual machine, you can't enable the SNMP agent. It is missing because of a non-free implementation. Move to the JVM provided by Oracle. |
Cacti configuration
Import in your Cacti configuration the content of the attachment cacti_host_template_jvm_host.xml
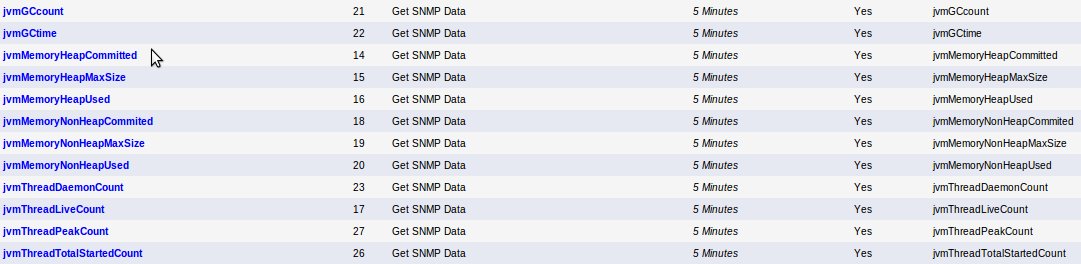
Next, create the following datasource from templates:
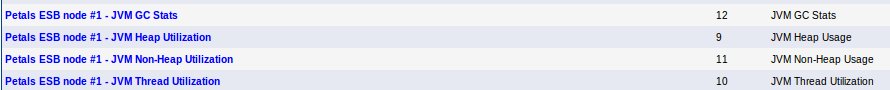
Next, create your graphs from templates:
Monitoring
Monitoring the container
Monitoring the local transporter
Metrics about delivered messages by the local transporter are available into the Petals container. A usage of these metrics can be the delivered messages by message exchange status whatever the endpoint, the service and the interface:
Unable to render embedded object: File (petals-delivered-messages.png) not found.
To create this graph, please follow the following steps:
- First, create a new Data Input Method:
Unable to render embedded object: File (petals-container-localtransporter-dim.jpg) not found.
In the Input String, you will put the command line needed to get the number of delivered messages for a given message exchange status. That's why the command line ends with <status>. - Add an input field to your data input method
Unable to render embedded object: File (petals-container-localtransporter-dim-status.jpg) not found. - Add the output field to your data input method
Unable to render embedded object: File (petals-container-localtransporter-dim-output.jpg) not found. - Create a new Data Template:
Unable to render embedded object: File (petals-container-localtransporter-dt.jpg) not found.
Select your data input method previously created as Data Input Method. - A new block Custom data appears, check Use Per-Data Source Value
Unable to render embedded object: File (petals-container-localtransporter-dt-custom.jpg) not found. - Create a new Graph Template:
Unable to render embedded object: File (petals-container-localtransporter-gt.jpg) not found.