IntroductionThe Petals BC Soap is composed of several internal components. Each one can be monitored and provides several metrics:
Moreover, as the Petals BC Soap is based on the Petals CDK, all common metrics are also provided, see Monitoring Petals CDK-based components. |
Table of contents
Contributors
No contributors found for: authors on selected page(s)
|
Monitoring the consumer side
Monitoring the thread pool processing incoming requests
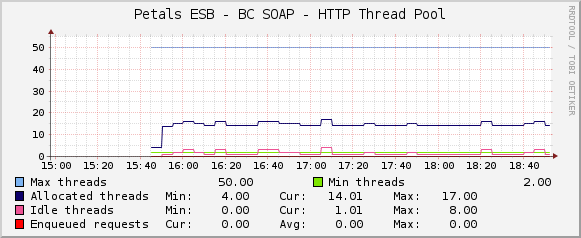
See Creating a graph using a simple data to graph the stats of the thread pool processing incoming requests:
- Script/Command of the data input method: petals-cli.sh -h <petals_host> -n <petals_jmx_port> -u <petals_jmx_user> -p <petals_jmx_password> -c -- monitoring -o petals-bc-soap -f http-thread-pool -- -n <petals-bc-soap-id>

If you have only one Petals BC SOAP installed on your Petals node, the input field petals-bc-soap-id can be replaced by its value - Output fields of the script/command:
Name Description Type ActiveThreadsMax The maximum number of active threads GAUGE ActiveThreadsCurrent The current number of active threads GAUGE IdleThreadsMax The maximum number of idle threads GAUGE IdleThreadsCurrent The current number of idle threads GAUGE MaxSize The maximum size of the thread pool GAUGE MinSize The minimum size of the thread pool GAUGE EnqueuedRequestsMax The maximum number of requests that are enqueued waiting a thread to be processed GAUGE EnqueuedRequestsCurrent The current number of requests that are enqueued waiting a thread to be processed GAUGE
Monitoring the incoming requests
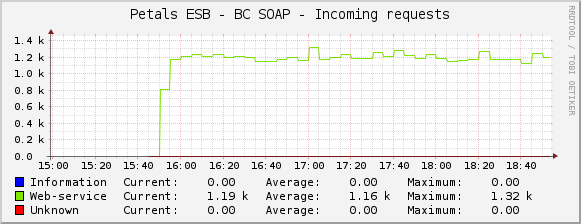
See Creating a graph using a simple data to graph the incoming requests:
- Script/Command of the data input method: petals-cli.sh -h <petals_host> -n <petals_jmx_port> -u <petals_jmx_user> -p <petals_jmx_password> -c -- monitoring -o petals-bc-soap -f incoming-http-requests-count -- -n <petals-bc-soap-id> -r
If you have only one Petals BC SOAP installed on your Petals node, the input field petals-bc-soap-id can be replaced by its value - Output fields of the script/command:
Name Description Type Information Number of information request received COUNTER Unknown Number of unknown request received COUNTER WS Number of web-service request received COUNTER ServiceContracts Number of web-service contract request received COUNTER
Monitoring the incoming web-service requests per operation and execution status
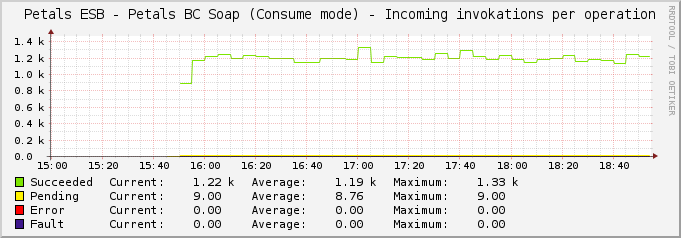
See Creating a graph using a data query to graph the stats about incoming web-service requests per operation:
- the data query definition to put in a file:
<interface>
        <name>Get web-service request number of the BC Soap per operation</name>
        <script_path>petals-cli.sh</script_path>
        <arg_prepend>-h localhost -n 7700 -u petals -p petals -c -- monitoring -o petals-bc-soap -f incoming-ws-requests-count</arg_prepend>
        <arg_index>-- -n petals-bc-soap --list-operations</arg_index>
        <arg_query>-- -n petals-bc-soap --query-operations</arg_query>
        <arg_get>-- -n petals-bc-soap --query-operations</arg_get>
        <output_delimeter>!</output_delimeter>
        <index_order>filterName</index_order>
        <index_order_type>alphanumeric</index_order_type>
        <!--index_title_format>|chosen_order_field|</index_title_format-->

        <fields>
                <filterName>
                        <name>Operation name</name>
                        <direction>input</direction>
                        <query_name>NAME</query_name>
                </filterName>
                <succeeded>
                        <name>Succeeded invocation counter</name>
                        <direction>output</direction>
                        <query_name>SUCCEEDED</query_name>
                </succeeded>
                <error>
                        <name>Failed invocation counter</name>
                        <direction>output</direction>
                        <query_name>ERROR</query_name>
                </error>
                <fault>
                        <name>Faulty invocation counter</name>
                        <direction>output</direction>
                        <query_name>FAULT</query_name>
                </fault>
                <pending>
                        <name>Pending invocation counter</name>
                        <direction>output</direction>
                        <query_name>PENDING</query_name>
                </pending>
        </fields>
</interface>
- Output fields of the script/command:
Name Description Type succeeded The succeeded invocation counter COUNTER error The failed invocation counter COUNTER fault The faulty invocation counter COUNTER pending The pending invocation counter GAUGE
Monitoring the response times of incoming web-service requests per operation and execution status
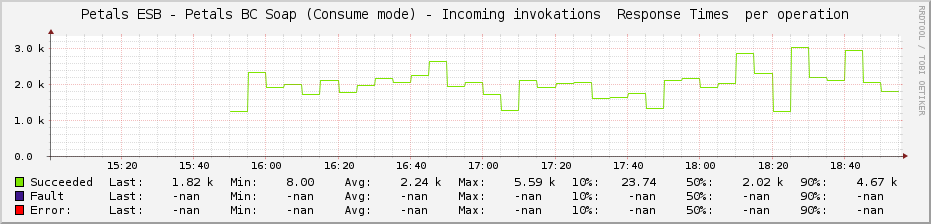
See Creating a graph using a data query to graph the stats about response times of incoming web-service requests per operation:
- the data query definition to put in a file:
<interface>
        <name>Get web-service response times of the BC Soap per operation</name>
        <script_path>petals-cli.sh</script_path>
        <arg_prepend>-h localhost -n 7700 -u petals -p petals -c -- monitoring -o petals-bc-soap -f incoming-ws-requests-response-times</arg_prepend>
        <arg_index>-- -n petals-bc-soap --list-operations</arg_index>
        <arg_query>-- -n petals-bc-soap --query-operations</arg_query>
        <arg_get>-- -n petals-bc-soap --query-operations</arg_get>
        <output_delimeter>!</output_delimeter>
        <index_order>filterName</index_order>
        <index_order_type>alphanumeric</index_order_type>
        <!--index_title_format>|chosen_order_field|</index_title_format-->

        <fields>
                <filterName>
                        <name>Operation name</name>
                        <direction>input</direction>
                        <query_name>NAME</query_name>
                </filterName>
                <succeededMin>
                        <name>Succeeded invocation: Min response time</name>
                        <direction>output</direction>
                        <query_name>SUCCEEDED_MIN</query_name>
                </succeededMin>
                <succeededAvg>
                        <name>Succeeded invocation: Avg response time</name>
                        <direction>output</direction>
                        <query_name>SUCCEEDED_AVG</query_name>
                </succeededAvg>
                <succeededMax>
                        <name>Succeeded invocation: Max response time</name>
                        <direction>output</direction>
                        <query_name>SUCCEEDED_MAX</query_name>
                </succeededMax>
                <succeeded10p>
                        <name>Succeeded invocation: 10-percentil response time</name>
                        <direction>output</direction>
                        <query_name>SUCCEEDED_10P</query_name>
                </succeeded10p>
                <succeeded50p>
                        <name>Succeeded invocation: 50-percentil response time</name>
                        <direction>output</direction>
                        <query_name>SUCCEEDED_50P</query_name>
                </succeeded50p>
                <succeeded90p>
                        <name>Succeeded invocation: 90-percentil response time</name>
                        <direction>output</direction>
                        <query_name>SUCCEEDED_90P</query_name>
                </succeeded90p>
                <errorMin>
                        <name>Failed invocation: Min response time</name>
                        <direction>output</direction>
                        <query_name>ERROR_MIN</query_name>
                </errorMin>
                ...
                <faultMin>
                        <name>Faulty invocation: Min response time</name>
                        <direction>output</direction>
                        <query_name>FAULT_MIN</query_name>
                </faultMin>
        </fields>
</interface>
- Output fields of the script/command:
Name Description Type succeededMin The min response time of succeeded invocations GAUGE succeededAvg The average response time of succeeded invocations GAUGE succeededMax The max response time of succeeded invocations GAUGE succeeded10p The 10-percentil response time of succeeded invocations GAUGE succeeded50p The 50-percentil response time of succeeded invocations GAUGE succeeded90p The 90-percentil response time of succeeded invocations GAUGE errorMin The min response time of failed invocations GAUGE errorAvg The average response time of failed invocations GAUGE errorMax The max response time of failed invocations GAUGE error10p The 10-percentil response time of failed invocations GAUGE error50p The 50-percentil response time of failed invocations GAUGE error90p The 90-percentil response time of failed invocations GAUGE faultMin The min response time of faulty invocations GAUGE faultAvg The average response time of faulty invocations GAUGE faultMax The max response time of faulty invocations GAUGE fault10p The 10-percentil response time of faulty invocations GAUGE fault50p The 50-percentil response time of faulty invocations GAUGE fault90p The 90-percentil response time of faulty invocations GAUGE
Monitoring the provider side
Monitoring the web-service client pools per operation of external web-service
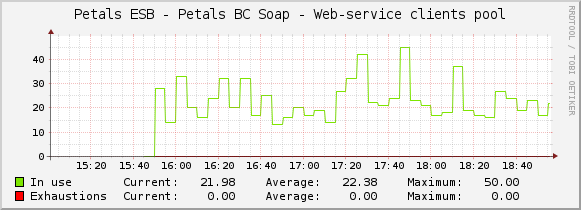
See Creating a graph using a data query to graph the stats about the web-service client pools per operation of external web-service:
- the data query definition to put in a file:
<interface>
        <name>Get web-service client pools of the BC Soap per operation</name>
        <script_path>/home/cdeneux/petals-cli-2.1.1-SNAPSHOT/bin/petals-cli.sh</script_path>
        <arg_prepend>-h localhost -n 7700 -u petals -p petals -c -- monitoring -o petals-bc-soap -f ws-clients-pools</arg_prepend>
        <arg_index>-- -n petals-bc-soap --list-operations</arg_index>
        <arg_query>-- -n petals-bc-soap --query-operations</arg_query>
        <arg_get>-- -n petals-bc-soap --query-operations</arg_get>
        <output_delimeter>!</output_delimeter>
        <index_order>filterName</index_order>
        <index_order_type>alphanumeric</index_order_type>
        <!--index_title_format>|chosen_order_field|</index_title_format-->

        <fields>
                <filterName>
                        <name>Operation name</name>
                        <direction>input</direction>
                        <query_name>URL</query_name>
                </filterName>
                <inUseCur>
                        <name>Web-service clients currently in use</name>
                        <direction>output</direction>
                        <query_name>INUSE_CUR</query_name>
                </inUseCur>
                <inUseMax>
                        <name>Maximum number of web-service clients to use concurrently</name>
                        <direction>output</direction>
                        <query_name>INUSE_MAX</query_name>
                </inUseMax>
                <exhaustions>
                        <name>Exhaustions</name>
                        <direction>output</direction>
                        <query_name>EXHAUSTIONS</query_name>
                </exhaustions>
        </fields>
</interface>
- Output fields of the script/command:
Name Description Type inUseMin Current number of web-service clients in use GAUGE inUsemax Maximum number of web-service clients to use concurrently GAUGE exhaustions Number of exhaustions COUNTER
Monitoring the outgoing web-service requests per operation and execution status
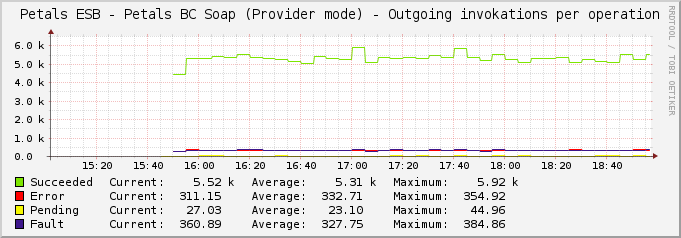
See Creating a graph using a data query to graph the stats about outgoing web-service requests per operation:
- the data query definition to put in a file:
<interface>
        <name>Get outgoing web-service request number of the BC Soap per operation</name>
        <script_path>petals-cli.sh</script_path>
        <arg_prepend>-h localhost -n 7700 -u petals -p petals -c -- monitoring -o petals-bc-soap -f outgoing-ws-requests-count</arg_prepend>
        <arg_index>-- -n petals-bc-soap --list-operations</arg_index>
        <arg_query>-- -n petals-bc-soap --query-operations</arg_query>
        <arg_get>-- -n petals-bc-soap --query-operations</arg_get>
        <output_delimeter>!</output_delimeter>
        <index_order>filterName</index_order>
        <index_order_type>alphanumeric</index_order_type>
        <!--index_title_format>|chosen_order_field|</index_title_format-->

        <fields>
                <filterName>
                        <name>Operation name</name>
                        <direction>input</direction>
                        <query_name>NAME</query_name>
                </filterName>
                <succeeded>
                        <name>Succeeded invocation counter</name>
                        <direction>output</direction>
                        <query_name>SUCCEEDED</query_name>
                </succeeded>
                <error>
                        <name>Failed invocation counter</name>
                        <direction>output</direction>
                        <query_name>ERROR</query_name>
                </error>
                <fault>
                        <name>Faulty invocation counter</name>
                        <direction>output</direction>
                        <query_name>FAULT</query_name>
                </fault>
                <pending>
                        <name>Pending invocation counter</name>
                        <direction>output</direction>
                        <query_name>PENDING</query_name>
                </pending>
        </fields>
</interface>
- Output fields of the script/command:
Name Description Type succeeded The succeeded invocation counter COUNTER error The failed invocation counter COUNTER fault The faulty invocation counter COUNTER pending The pending invocation counter GAUGE
Monitoring the response times of outgoing web-service requests per operation and execution status
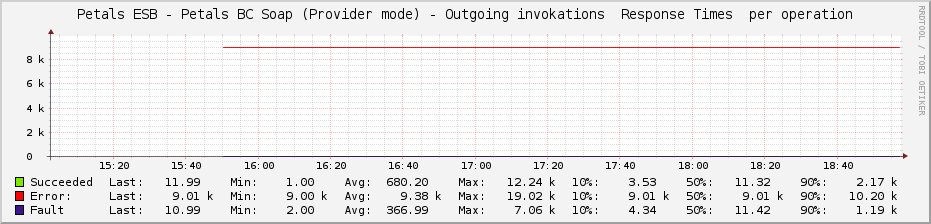
See Creating a graph using a data query to graph the stats about response times of outgoing web-service requests per operation:
- the data query definition to put in a file:
<interface>
        <name>Get outgoing web-service response times of the BC Soap per operation</name>
        <script_path>petals-cli.sh</script_path>
        <arg_prepend>-h localhost -n 7700 -u petals -p petals -c -- monitoring -o petals-bc-soap -f outgoing-ws-requests-response-times</arg_prepend>
        <arg_index>-- -n petals-bc-soap --list-operations</arg_index>
        <arg_query>-- -n petals-bc-soap --query-operations</arg_query>
        <arg_get>-- -n petals-bc-soap --query-operations</arg_get>
        <output_delimeter>!</output_delimeter>
        <index_order>filterName</index_order>
        <index_order_type>alphanumeric</index_order_type>
        <!--index_title_format>|chosen_order_field|</index_title_format-->

        <fields>
                <filterName>
                        <name>Operation name</name>
                        <direction>input</direction>
                        <query_name>NAME</query_name>
                </filterName>
                <succeededMin>
                        <name>Succeeded invocation: Min response time</name>
                        <direction>output</direction>
                        <query_name>SUCCEEDED_MIN</query_name>
                </succeededMin>
                <succeededAvg>
                        <name>Succeeded invocation: Avg response time</name>
                        <direction>output</direction>
                        <query_name>SUCCEEDED_AVG</query_name>
                </succeededAvg>
                <succeededMax>
                        <name>Succeeded invocation: Max response time</name>
                        <direction>output</direction>
                        <query_name>SUCCEEDED_MAX</query_name>
                </succeededMax>
                <succeeded10p>
                        <name>Succeeded invocation: 10-percentil response time</name>
                        <direction>output</direction>
                        <query_name>SUCCEEDED_10P</query_name>
                </succeeded10p>
                <succeeded50p>
                        <name>Succeeded invocation: 50-percentil response time</name>
                        <direction>output</direction>
                        <query_name>SUCCEEDED_50P</query_name>
                </succeeded50p>
                <succeeded90p>
                        <name>Succeeded invocation: 90-percentil response time</name>
                        <direction>output</direction>
                        <query_name>SUCCEEDED_90P</query_name>
                </succeeded90p>
                <errorMin>
                        <name>Failed invocation: Min response time</name>
                        <direction>output</direction>
                        <query_name>ERROR_MIN</query_name>
                </errorMin>
                ...
                <faultMin>
                        <name>Faulty invocation: Min response time</name>
                        <direction>output</direction>
                        <query_name>FAULT_MIN</query_name>
                </faultMin>
        </fields>
</interface>
- Output fields of the script/command:
Name Description Type succeededMin The min response time of succeeded invocations GAUGE succeededAvg The average response time of succeeded invocations GAUGE succeededMax The max response time of succeeded invocations GAUGE succeeded10p The 10-percentil response time of succeeded invocations GAUGE succeeded50p The 50-percentil response time of succeeded invocations GAUGE succeeded90p The 90-percentil response time of succeeded invocations GAUGE errorMin The min response time of failed invocations GAUGE errorAvg The average response time of failed invocations GAUGE errorMax The max response time of failed invocations GAUGE error10p The 10-percentil response time of failed invocations GAUGE error50p The 50-percentil response time of failed invocations GAUGE error90p The 90-percentil response time of failed invocations GAUGE faultMin The min response time of faulty invocations GAUGE faultAvg The average response time of faulty invocations GAUGE faultMax The max response time of faulty invocations GAUGE fault10p The 10-percentil response time of faulty invocations GAUGE fault50p The 50-percentil response time of faulty invocations GAUGE fault90p The 90-percentil response time of faulty invocations GAUGE